


よむ、つかう、まなぶ。
商業動態統計速報 2025年2月分 (3 ページ)
出典
| 公開元URL | |
| 出典情報 | 商業動態統計速報 2025年2月分(3/31)《経済産業省》 |
ページ画像
ダウンロードした画像を利用する際は「出典情報」を明記してください。
低解像度画像をダウンロード
プレーンテキスト
資料テキストはコンピュータによる自動処理で生成されており、完全に資料と一致しない場合があります。
テキストをコピーしてご利用いただく際は資料と付け合わせてご確認ください。
商業販売額の動向
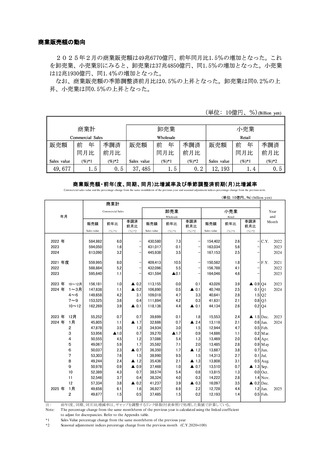
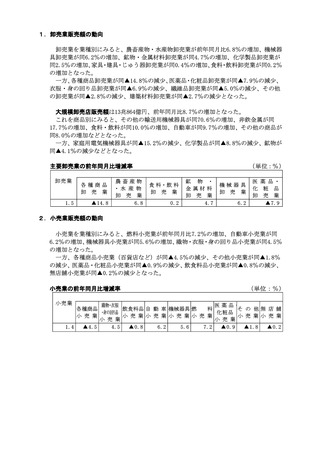
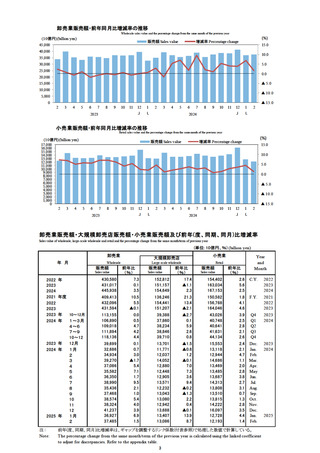
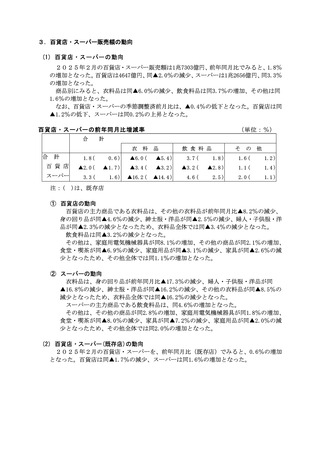
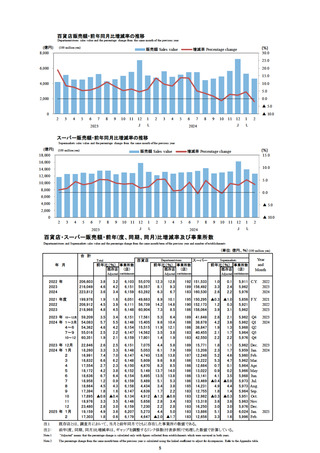
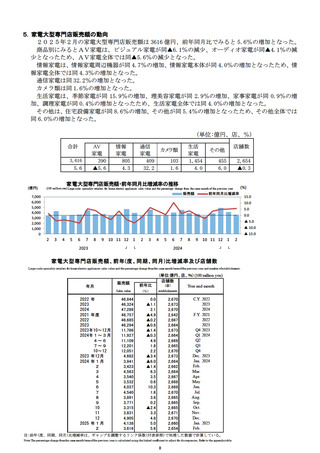
2025年2月の商業販売額は49兆6770億円、前年同月比1.5%の増加となった。これ
を卸売業、小売業別にみると、卸売業は37兆4850億円、同1.5%の増加となった。小売業
は12兆1930億円、同1.4%の増加となった。
なお、商業販売額の季節調整済前月比は0.5%の上昇となった。卸売業は同0.2%の上
昇、小売業は同0.5%の上昇となった。
(単位: 10億円、%)(Billion yen)
商業計
卸売業
小売業
Commercial Sales
Wholesale
Retail
販売額
前 年
同月比
季調済
前月比
販売額
前 年
同月比
季調済
前月比
販売額
前 年
同月比
季調済
前月比
Sales value
(%)*1
(%)*2
Sales value
(%)*1
(%)*2
Sales value
(%)*1
(%)*2
49,677
1.5
0.5
37,485
1.5
0.2
12,193
1.4
0.5
商業販売額・前年(度、同期、同月)比増減率及び季節調整済前期(月)比増減率
Commercial sales value and the percentage change from the same month/term of the previous y ear and seasonal adjustment indices percentage change from the previous term.
(単位: 10億円、%) (billion yen)
商業計
Commercial Sales
年月
小売業
Wholesale
Retail
販売額
前年比
季調済
前月比
販売額
前年比
季調済
前月比
販売額
前年比
季調済
前月比
Sales value
(%)*1
(%)*2
Sales value
(%)*1
(%)*2
Sales value
(%)*1
(%)*2
Year
and
Month
2022 年
2023
2024
584,982
594,050
613,090
6.0
1.6
3.2
-
430,580
431,017
445,938
7.3
0.1
3.5
-
154,402
163,034
167,153
2.6
5.6
2.5
- C.Y.
-
2022
2023
2024
2021 年度
2022
2023
559,995
588,884
595,640
8.0
5.2
1.1
-
409,413
432,096
431,594
10.5
5.5
▲0.1
-
150,582
156,788
164,046
1.8
4.1
4.6
- F.Y.
-
2021
2022
2023
2023 年 10~12月
2024 年 1~3月
4~6
7~9
10~12
156,181
147,638
149,658
153,525
162,269
1.0
1.1
4.2
3.6
3.9
▲ 0.2
▲ 0.2
3.1
0.4
▲ 0.1
113,155
106,890
109,018
111,894
118,136
0.0
0.5
4.7
4.2
4.4
0.1
▲ 0.1
3.3
0.3
▲ 0.1
43,026
40,748
40,641
41,631
44,134
3.9
2.5
2.8
2.1
2.6
▲ 0.9 Q4
0.1 Q1
1.5 Q2
0.8 Q3
0.2 Q4
2023
2024
2023 年 12月
2024 年 1月
2
3
4
5
6
7
8
9
10
11
12
2025 年 1月
2
55,252
45,805
47,878
53,956
50,555
49,067
50,037
53,303
49,244
50,978
52,389
52,546
57,334
49,656
49,677
0.7
1.1
3.5
▲1.0
4.5
5.9
2.3
7.6
2.4
0.9
4.3
3.7
3.8
6.1
1.5
0.7
▲ 1.7
1.3
0.7
1.2
1.7
▲ 0.7
1.5
▲ 1.2
▲ 0.9
0.7
0.4
▲ 0.2
1.6
0.5
39,699
32,686
34,934
39,270
37,086
35,582
36,350
38,990
35,436
37,468
38,574
38,324
41,237
36,927
37,485
0.1
0.7
3.0
▲1.7
5.4
7.1
1.7
9.5
2.1
1.0
5.4
4.0
3.9
6.9
1.5
1.8
▲ 2.4
1.5
0.9
1.3
2.0
▲ 1.2
1.5
▲ 1.3
▲ 0.7
0.8
0.3
▲ 0.3
2.2
0.2
15,553
13,118
12,944
14,686
13,469
13,485
13,687
14,313
13,808
13,510
13,815
14,222
16,097
12,728
12,193
2.4
2.1
4.7
1.1
2.0
2.8
3.8
2.7
3.1
0.7
1.3
2.8
3.5
4.4
1.4
▲ 1.5 Dec.
0.6 Jan.
0.5 Feb.
0.2 M ar.
0.4 Apr.
0.9 M ay
0.7 Jun.
0.1 Jul.
0.5 Aug.
▲ 1.3 Sep.
0.0 Oct.
1.4 Nov.
▲ 0.2 Dec.
1.2 Jan.
0.5 Feb.
2023
2024
注:
Note:
*1
*2
卸売業
前年(度、同期、同月)比増減率は、ギャップを調整するリンク係数(付表参照)で処理した数値で計算している。
T he percentage change from the same month/term of the previous year is calculated using the linked coefficient
to adjust for discrepancies. Refer to the Appendix table.
Sales Value percentage change from the same month/term of the previous year
Seasonal adjustement indices percentage change from the previous month (C.Y.2020=100)
1
2025