


よむ、つかう、まなぶ。
商業動態統計速報 2024年1月分 (3 ページ)
出典
| 公開元URL | https://www.meti.go.jp/statistics/tyo/syoudou/result/sokuho_2.html |
| 出典情報 | 商業動態統計速報 2024年1月分(2/29)《経済産業省》 |
ページ画像
ダウンロードした画像を利用する際は「出典情報」を明記してください。
低解像度画像をダウンロード
プレーンテキスト
資料テキストはコンピュータによる自動処理で生成されており、完全に資料と一致しない場合があります。
テキストをコピーしてご利用いただく際は資料と付け合わせてご確認ください。
商業販売額の動向
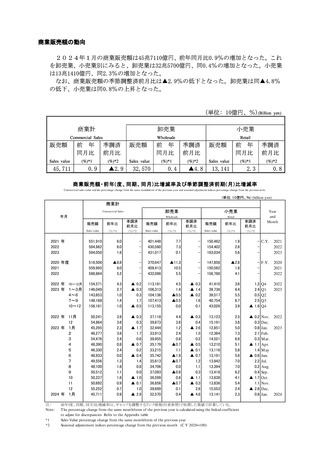
2024年1月の商業販売額は45兆7110億円、前年同月比0.9%の増加となった。これ
を卸売業、小売業別にみると、卸売業は32兆5700億円、同0.4%の増加となった。小売業
は13兆1410億円、同2.3%の増加となった。
なお、商業販売額の季節調整済前月比は▲2.9%の低下となった。卸売業は同▲4.8%
の低下、小売業は同0.8%の上昇となった。
(単位: 10億円、%)(Billion yen)
商業計
卸売業
小売業
Commercial Sales
Wholesale
Retail
販売額
前 年
同月比
季調済
前月比
販売額
前 年
同月比
季調済
前月比
販売額
前 年
同月比
季調済
前月比
Sales value
(%)*1
(%)*2
Sales value
(%)*1
(%)*2
Sales value
(%)*1
(%)*2
▲2.9
32,570
▲4.8
13,141
45,711
0.9
0.4
2.3
0.8
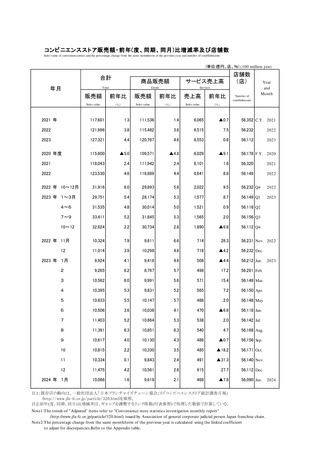
商業販売額・前年(度、同期、同月)比増減率及び季節調整済前期(月)比増減率
Commercial sales value and the percentage change from the same month/term of the previous y ear and seasonal adjustment indices percentage change from the previous term.
(単位: 10億円、%) (billion yen)
商業計
Commercial Sales
年月
小売業
Wholesale
Retail
販売額
前年比
季調済
前月比
販売額
前年比
季調済
前月比
販売額
前年比
季調済
前月比
Sales value
(%)*1
(%)*2
Sales value
(%)*1
(%)*2
Sales value
(%)*1
(%)*2
Year
and
Month
2021 年
2022
2023
551,910
584,982
594,050
6.0
6.0
1.6
-
401,448
430,580
431,017
7.7
7.3
0.1
-
150,462
154,402
163,034
1.9
2.6
5.6
- C.Y.
-
2021
2022
2023
2020 年度
2021
2022
518,506
559,995
588,884
▲8.8
8.0
5.2
-
370,647
409,413
432,096
▲11.3
10.5
5.5
-
147,858
150,582
156,788
▲2.8
1.8
4.1
- F.Y.
-
2020
2021
2022
2022 年 10~12月
2023 年 1~3月
4~6
7~9
10~12
154,571
146,049
143,653
148,168
156,181
4.3
2.7
1.0
1.4
1.0
▲ 0.2
▲ 0.3
0.3
1.7
▲ 0.5
113,161
106,313
104,136
107,413
113,155
4.5
1.4
▲0.5
▲0.5
0.0
▲ 0.3
▲ 1.4
▲ 0.2
1.6
0.1
41,410
39,736
39,517
40,754
43,026
3.6
6.4
5.5
6.7
3.9
1.2 Q4
2.4 Q1
0.5 Q2
2.5 Q3
▲ 1.6 Q4
2022
2023
2022 年 11月
12
2023 年 1月
2
3
4
5
6
7
8
9
10
11
12
2024 年 1月
50,241
54,864
45,295
46,277
54,476
48,390
46,330
48,933
49,556
48,100
50,512
50,237
50,692
55,252
45,711
3.9
3.6
2.3
3.6
2.4
0.8
2.4
0.0
1.3
1.8
1.1
1.6
0.9
0.7
0.9
▲ 0.3
0.3
▲ 1.7
1.7
0.6
▲ 0.7
0.2
▲ 0.4
1.4
0.8
0.0
▲ 1.0
▲ 0.1
1.0
▲ 2.9
37,118
39,673
32,444
33,913
39,955
35,179
33,215
35,742
35,613
34,706
37,093
36,599
36,856
39,699
32,570
4.4
3.6
1.2
2.4
0.8
▲0.7
1.1
▲1.9
▲0.7
0.0
▲0.6
0.6
▲0.7
0.1
0.4
▲ 0.3
0.4
▲ 2.6
1.5
0.2
▲ 0.5
▲ 0.1
▲ 0.7
1.2
1.1
0.3
▲ 1.1
▲ 0.3
2.6
▲ 4.8
13,123
15,191
12,851
12,364
14,521
13,210
13,116
13,191
13,942
13,394
13,418
13,638
13,836
15,553
13,141
2.5
3.8
5.0
7.3
6.9
5.1
5.8
5.6
7.0
7.0
6.2
4.1
5.4
2.4
2.3
▲ 0.2 Nov.
0.3 Dec.
0.8 Jan.
2.1 Feb.
0.3 M ar.
▲ 1.1 Apr.
1.4 M ay
▲ 0.6 Jun.
2.2 Jul.
0.2 Aug.
0.4 Sep.
▲ 1.7 Oct.
1.1 Nov.
▲ 2.6 Dec.
0.8 Jan.
2022
注:
Note:
*1
*2
卸売業
前年(度、同期、同月)比増減率は、ギャップを調整するリンク係数(付表参照)で処理した数値で計算している。
T he percentage change from the same month/term of the previous year is calculated using the linked coefficient
to adjust for discrepancies Refer to the Appendix table
Sales Value percentage change from the same month/term of the previous year
Seasonal adjustement indices percentage change from the previous month (C Y 2020=100)
1
2023
2024
2024年1月の商業販売額は45兆7110億円、前年同月比0.9%の増加となった。これ
を卸売業、小売業別にみると、卸売業は32兆5700億円、同0.4%の増加となった。小売業
は13兆1410億円、同2.3%の増加となった。
なお、商業販売額の季節調整済前月比は▲2.9%の低下となった。卸売業は同▲4.8%
の低下、小売業は同0.8%の上昇となった。
(単位: 10億円、%)(Billion yen)
商業計
卸売業
小売業
Commercial Sales
Wholesale
Retail
販売額
前 年
同月比
季調済
前月比
販売額
前 年
同月比
季調済
前月比
販売額
前 年
同月比
季調済
前月比
Sales value
(%)*1
(%)*2
Sales value
(%)*1
(%)*2
Sales value
(%)*1
(%)*2
▲2.9
32,570
▲4.8
13,141
45,711
0.9
0.4
2.3
0.8
商業販売額・前年(度、同期、同月)比増減率及び季節調整済前期(月)比増減率
Commercial sales value and the percentage change from the same month/term of the previous y ear and seasonal adjustment indices percentage change from the previous term.
(単位: 10億円、%) (billion yen)
商業計
Commercial Sales
年月
小売業
Wholesale
Retail
販売額
前年比
季調済
前月比
販売額
前年比
季調済
前月比
販売額
前年比
季調済
前月比
Sales value
(%)*1
(%)*2
Sales value
(%)*1
(%)*2
Sales value
(%)*1
(%)*2
Year
and
Month
2021 年
2022
2023
551,910
584,982
594,050
6.0
6.0
1.6
-
401,448
430,580
431,017
7.7
7.3
0.1
-
150,462
154,402
163,034
1.9
2.6
5.6
- C.Y.
-
2021
2022
2023
2020 年度
2021
2022
518,506
559,995
588,884
▲8.8
8.0
5.2
-
370,647
409,413
432,096
▲11.3
10.5
5.5
-
147,858
150,582
156,788
▲2.8
1.8
4.1
- F.Y.
-
2020
2021
2022
2022 年 10~12月
2023 年 1~3月
4~6
7~9
10~12
154,571
146,049
143,653
148,168
156,181
4.3
2.7
1.0
1.4
1.0
▲ 0.2
▲ 0.3
0.3
1.7
▲ 0.5
113,161
106,313
104,136
107,413
113,155
4.5
1.4
▲0.5
▲0.5
0.0
▲ 0.3
▲ 1.4
▲ 0.2
1.6
0.1
41,410
39,736
39,517
40,754
43,026
3.6
6.4
5.5
6.7
3.9
1.2 Q4
2.4 Q1
0.5 Q2
2.5 Q3
▲ 1.6 Q4
2022
2023
2022 年 11月
12
2023 年 1月
2
3
4
5
6
7
8
9
10
11
12
2024 年 1月
50,241
54,864
45,295
46,277
54,476
48,390
46,330
48,933
49,556
48,100
50,512
50,237
50,692
55,252
45,711
3.9
3.6
2.3
3.6
2.4
0.8
2.4
0.0
1.3
1.8
1.1
1.6
0.9
0.7
0.9
▲ 0.3
0.3
▲ 1.7
1.7
0.6
▲ 0.7
0.2
▲ 0.4
1.4
0.8
0.0
▲ 1.0
▲ 0.1
1.0
▲ 2.9
37,118
39,673
32,444
33,913
39,955
35,179
33,215
35,742
35,613
34,706
37,093
36,599
36,856
39,699
32,570
4.4
3.6
1.2
2.4
0.8
▲0.7
1.1
▲1.9
▲0.7
0.0
▲0.6
0.6
▲0.7
0.1
0.4
▲ 0.3
0.4
▲ 2.6
1.5
0.2
▲ 0.5
▲ 0.1
▲ 0.7
1.2
1.1
0.3
▲ 1.1
▲ 0.3
2.6
▲ 4.8
13,123
15,191
12,851
12,364
14,521
13,210
13,116
13,191
13,942
13,394
13,418
13,638
13,836
15,553
13,141
2.5
3.8
5.0
7.3
6.9
5.1
5.8
5.6
7.0
7.0
6.2
4.1
5.4
2.4
2.3
▲ 0.2 Nov.
0.3 Dec.
0.8 Jan.
2.1 Feb.
0.3 M ar.
▲ 1.1 Apr.
1.4 M ay
▲ 0.6 Jun.
2.2 Jul.
0.2 Aug.
0.4 Sep.
▲ 1.7 Oct.
1.1 Nov.
▲ 2.6 Dec.
0.8 Jan.
2022
注:
Note:
*1
*2
卸売業
前年(度、同期、同月)比増減率は、ギャップを調整するリンク係数(付表参照)で処理した数値で計算している。
T he percentage change from the same month/term of the previous year is calculated using the linked coefficient
to adjust for discrepancies Refer to the Appendix table
Sales Value percentage change from the same month/term of the previous year
Seasonal adjustement indices percentage change from the previous month (C Y 2020=100)
1
2023
2024