


よむ、つかう、まなぶ。
商業動態統計速報 2024年6月分 (3 ページ)
出典
| 公開元URL | https://www.meti.go.jp/statistics/tyo/syoudou/result/sokuho_2.html |
| 出典情報 | 商業動態統計速報 2024年6月分(7/31)《経済産業省》 |
ページ画像
ダウンロードした画像を利用する際は「出典情報」を明記してください。
低解像度画像をダウンロード
プレーンテキスト
資料テキストはコンピュータによる自動処理で生成されており、完全に資料と一致しない場合があります。
テキストをコピーしてご利用いただく際は資料と付け合わせてご確認ください。
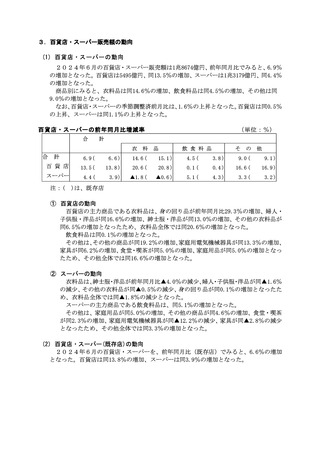
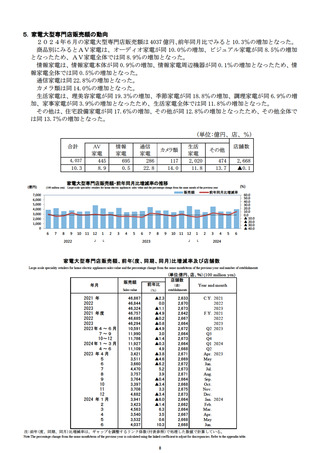
商業販売額の動向
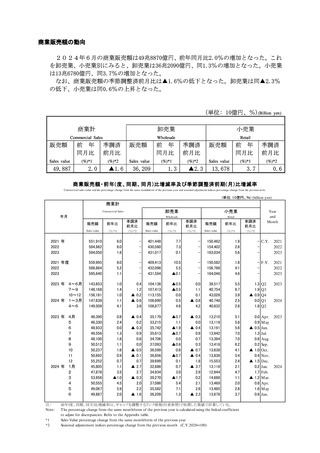
2024年6月の商業販売額は49兆8870億円、前年同月比2.0%の増加となった。これ
を卸売業、小売業別にみると、卸売業は36兆2090億円、同1.3%の増加となった。小売業
は13兆6780億円、同3.7%の増加となった。
なお、商業販売額の季節調整済前月比は▲1.6%の低下となった。卸売業は同▲2.3%
の低下、小売業は同0.6%の上昇となった。
(単位: 10億円、%)(Billion yen)
商業計
卸売業
小売業
Commercial Sales
Wholesale
Retail
販売額
前 年
同月比
季調済
前月比
販売額
前 年
同月比
季調済
前月比
販売額
前 年
同月比
季調済
前月比
Sales value
(%)*1
(%)*2
Sales value
(%)*1
(%)*2
Sales value
(%)*1
(%)*2
▲1.6
36,209
▲2.3
13,678
49,887
2.0
1.3
3.7
0.6
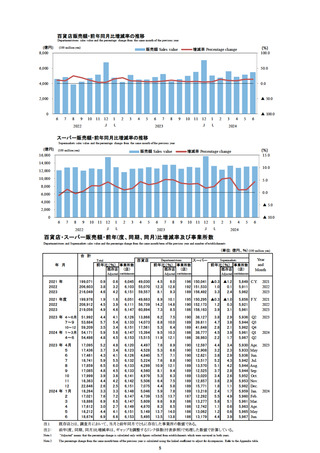
商業販売額・前年(度、同期、同月)比増減率及び季節調整済前期(月)比増減率
Commercial sales value and the percentage change from the same month/term of the previous y ear and seasonal adjustment indices percentage change from the previous term.
(単位: 10億円、%) (billion yen)
商業計
Commercial Sales
年月
小売業
Wholesale
Retail
販売額
前年比
季調済
前月比
販売額
前年比
季調済
前月比
販売額
前年比
季調済
前月比
Sales value
(%)*1
(%)*2
Sales value
(%)*1
(%)*2
Sales value
(%)*1
(%)*2
Year
and
Month
2021 年
2022
2023
551,910
584,982
594,050
6.0
6.0
1.6
-
401,448
430,580
431,017
7.7
7.3
0.1
-
150,462
154,402
163,034
1.9
2.6
5.6
- C.Y.
-
2021
2022
2023
2021 年度
2022
2023
559,995
588,884
595,640
8.0
5.2
1.1
-
409,413
432,096
431,594
10.5
5.5
▲0.1
-
150,582
156,788
164,046
1.8
4.1
4.6
- F.Y.
-
2021
2022
2023
2023 年 4~6月
7~9
10~12
2024 年 1~3月
4~6
143,653
148,168
156,181
147,638
149,509
1.0
1.4
1.0
1.1
4.1
0.4
1.2
▲ 0.2
▲ 0.6
3.6
104,136
107,413
113,155
106,890
108,877
▲0.5
▲0.5
0.0
0.5
4.6
0.0
1.1
0.1
▲ 0.8
4.2
39,517
40,754
43,026
40,748
40,632
5.5
6.7
3.9
2.5
2.8
1.3 Q2
1.9 Q3
▲ 0.9 Q4
0.0 Q1
1.8 Q2
2023
2023 年 4月
5
6
7
8
9
10
11
12
2024 年 1月
2
3
4
5
6
48,390
46,330
48,933
49,556
48,100
50,512
50,237
50,692
55,252
45,805
47,878
53,956
50,555
49,067
49,887
0.8
2.4
0.0
1.3
1.8
1.1
1.6
0.9
0.7
1.1
3.5
▲1.0
4.5
5.9
2.0
▲ 0.4
0.2
▲ 0.3
0.9
0.6
0.0
▲ 0.5
▲ 0.1
0.7
▲ 2.7
2.7
▲ 0.3
2.0
2.2
▲ 1.6
35,179
33,215
35,742
35,613
34,706
37,093
36,599
36,856
39,699
32,686
34,934
39,270
37,086
35,582
36,209
▲0.7
1.1
▲1.9
▲0.7
0.0
▲0.6
0.6
▲0.7
0.1
0.7
3.0
▲1.7
5.4
7.1
1.3
▲ 0.3
0.0
▲ 0.4
0.9
0.7
0.3
▲ 0.7
▲ 0.4
1.8
▲ 3.7
2.9
0.2
2.1
2.6
▲ 2.3
13,210
13,116
13,191
13,942
13,394
13,418
13,638
13,836
15,553
13,118
12,944
14,686
13,469
13,485
13,678
5.1
5.8
5.6
7.0
7.0
6.2
4.1
5.4
2.4
2.1
4.7
1.1
2.0
2.8
3.7
0.0 Apr.
0.9 M ay
▲ 0.5 Jun.
1.3 Jul.
0.8 Aug.
0.2 Sep.
▲ 1.0 Oct.
0.4 Nov.
▲ 1.5 Dec.
0.2 Jan.
1.7 Feb.
▲ 1.2 M ar.
0.8 Apr.
1.6 M ay
0.6 Jun.
2023
注:
Note:
*1
*2
卸売業
前年(度、同期、同月)比増減率は、ギャップを調整するリンク係数(付表参照)で処理した数値で計算している。
T he percentage change from the same month/term of the previous year is calculated using the linked coefficient
to adjust for discrepancies. Refer to the Appendix table.
Sales Value percentage change from the same month/term of the previous year
Seasonal adjustement indices percentage change from the previous month (C.Y.2020=100)
1
2024
2024
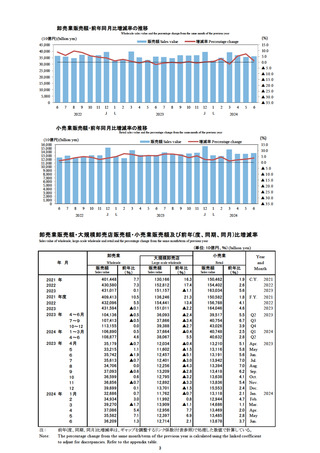
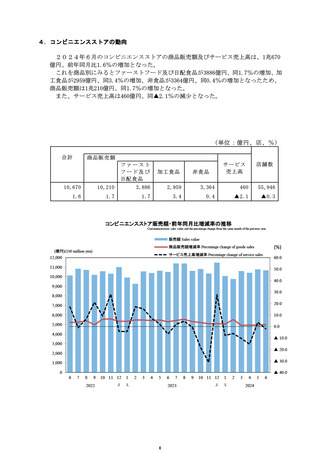
2024年6月の商業販売額は49兆8870億円、前年同月比2.0%の増加となった。これ
を卸売業、小売業別にみると、卸売業は36兆2090億円、同1.3%の増加となった。小売業
は13兆6780億円、同3.7%の増加となった。
なお、商業販売額の季節調整済前月比は▲1.6%の低下となった。卸売業は同▲2.3%
の低下、小売業は同0.6%の上昇となった。
(単位: 10億円、%)(Billion yen)
商業計
卸売業
小売業
Commercial Sales
Wholesale
Retail
販売額
前 年
同月比
季調済
前月比
販売額
前 年
同月比
季調済
前月比
販売額
前 年
同月比
季調済
前月比
Sales value
(%)*1
(%)*2
Sales value
(%)*1
(%)*2
Sales value
(%)*1
(%)*2
▲1.6
36,209
▲2.3
13,678
49,887
2.0
1.3
3.7
0.6
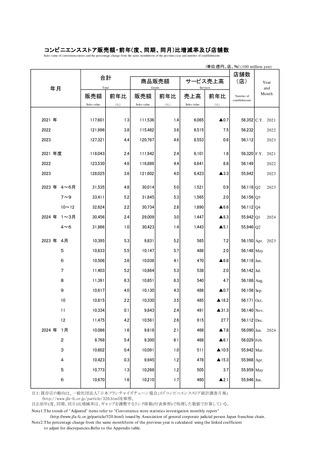
商業販売額・前年(度、同期、同月)比増減率及び季節調整済前期(月)比増減率
Commercial sales value and the percentage change from the same month/term of the previous y ear and seasonal adjustment indices percentage change from the previous term.
(単位: 10億円、%) (billion yen)
商業計
Commercial Sales
年月
小売業
Wholesale
Retail
販売額
前年比
季調済
前月比
販売額
前年比
季調済
前月比
販売額
前年比
季調済
前月比
Sales value
(%)*1
(%)*2
Sales value
(%)*1
(%)*2
Sales value
(%)*1
(%)*2
Year
and
Month
2021 年
2022
2023
551,910
584,982
594,050
6.0
6.0
1.6
-
401,448
430,580
431,017
7.7
7.3
0.1
-
150,462
154,402
163,034
1.9
2.6
5.6
- C.Y.
-
2021
2022
2023
2021 年度
2022
2023
559,995
588,884
595,640
8.0
5.2
1.1
-
409,413
432,096
431,594
10.5
5.5
▲0.1
-
150,582
156,788
164,046
1.8
4.1
4.6
- F.Y.
-
2021
2022
2023
2023 年 4~6月
7~9
10~12
2024 年 1~3月
4~6
143,653
148,168
156,181
147,638
149,509
1.0
1.4
1.0
1.1
4.1
0.4
1.2
▲ 0.2
▲ 0.6
3.6
104,136
107,413
113,155
106,890
108,877
▲0.5
▲0.5
0.0
0.5
4.6
0.0
1.1
0.1
▲ 0.8
4.2
39,517
40,754
43,026
40,748
40,632
5.5
6.7
3.9
2.5
2.8
1.3 Q2
1.9 Q3
▲ 0.9 Q4
0.0 Q1
1.8 Q2
2023
2023 年 4月
5
6
7
8
9
10
11
12
2024 年 1月
2
3
4
5
6
48,390
46,330
48,933
49,556
48,100
50,512
50,237
50,692
55,252
45,805
47,878
53,956
50,555
49,067
49,887
0.8
2.4
0.0
1.3
1.8
1.1
1.6
0.9
0.7
1.1
3.5
▲1.0
4.5
5.9
2.0
▲ 0.4
0.2
▲ 0.3
0.9
0.6
0.0
▲ 0.5
▲ 0.1
0.7
▲ 2.7
2.7
▲ 0.3
2.0
2.2
▲ 1.6
35,179
33,215
35,742
35,613
34,706
37,093
36,599
36,856
39,699
32,686
34,934
39,270
37,086
35,582
36,209
▲0.7
1.1
▲1.9
▲0.7
0.0
▲0.6
0.6
▲0.7
0.1
0.7
3.0
▲1.7
5.4
7.1
1.3
▲ 0.3
0.0
▲ 0.4
0.9
0.7
0.3
▲ 0.7
▲ 0.4
1.8
▲ 3.7
2.9
0.2
2.1
2.6
▲ 2.3
13,210
13,116
13,191
13,942
13,394
13,418
13,638
13,836
15,553
13,118
12,944
14,686
13,469
13,485
13,678
5.1
5.8
5.6
7.0
7.0
6.2
4.1
5.4
2.4
2.1
4.7
1.1
2.0
2.8
3.7
0.0 Apr.
0.9 M ay
▲ 0.5 Jun.
1.3 Jul.
0.8 Aug.
0.2 Sep.
▲ 1.0 Oct.
0.4 Nov.
▲ 1.5 Dec.
0.2 Jan.
1.7 Feb.
▲ 1.2 M ar.
0.8 Apr.
1.6 M ay
0.6 Jun.
2023
注:
Note:
*1
*2
卸売業
前年(度、同期、同月)比増減率は、ギャップを調整するリンク係数(付表参照)で処理した数値で計算している。
T he percentage change from the same month/term of the previous year is calculated using the linked coefficient
to adjust for discrepancies. Refer to the Appendix table.
Sales Value percentage change from the same month/term of the previous year
Seasonal adjustement indices percentage change from the previous month (C.Y.2020=100)
1
2024
2024