

よむ、つかう、まなぶ。
商業動態統計速報 2024年12月分 (9 ページ)
出典
| 公開元URL | |
| 出典情報 | 商業動態統計速報 2024年12月分(1/31)《経済産業省》 |
ページ画像
ダウンロードした画像を利用する際は「出典情報」を明記してください。
低解像度画像をダウンロード
プレーンテキスト
資料テキストはコンピュータによる自動処理で生成されており、完全に資料と一致しない場合があります。
テキストをコピーしてご利用いただく際は資料と付け合わせてご確認ください。
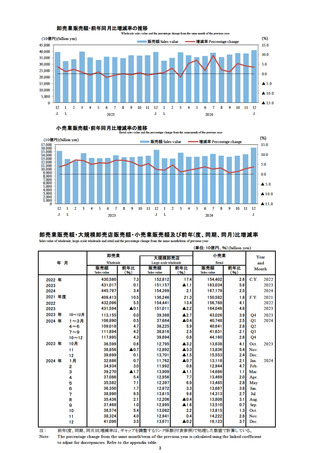
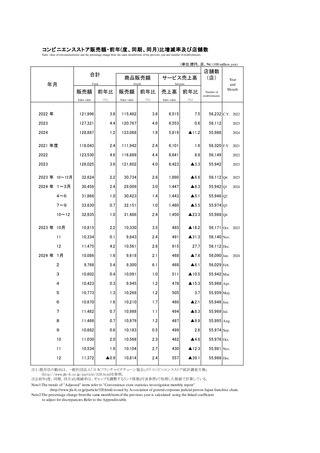
コンビニエンスストア販売額・前年(度、同期、同月)比増減率及び店舗数
Sales value of conveniencestores and the percentage change from the same month/term of the previous year and number of establishments
(単位:億円、店、%) (100 million yen)
合計
年月
商品販売額
サービス売上高
Goods
Services
Total
販売額
前年比
販売額
前年比
売上高
前年比
Sales value
(%)
Sales value
(%)
Sales value
(%)
店舗数
(店)
Number of
establishments
Year
and
Month
2022 年
121,996
3.8
115,482
3.6
6,515
7.5
56,232 C.Y. 2022
2023
127,321
4.4
120,767
4.6
6,553
0.6
56,112
2023
2024
128,887
1.2
123,068
1.9
5,819
▲11.2
55,988
2024
2021 年度
118,043
2.4
111,942
2.4
6,101
1.6
56,320 F.Y. 2021
2022
123,530
4.6
116,889
4.4
6,641
8.8
56,149
2022
2023
128,025
3.6
121,602
4.0
6,423
▲3.3
55,942
2023
2023 年 10~12月
32,624
2.2
30,734
2.8
1,890
▲6.6
56,112 Q4
2023
2024 年 1~3月
30,456
2.4
29,009
3.0
1,447
▲8.3
55,942 Q1
2024
4~6
31,866
1.0
30,423
1.4
1,443
▲5.1
55,946 Q2
7~9
33,630
0.7
32,151
1.0
1,480
▲5.5
55,974 Q3
10~12
32,935
1.0
31,486
2.4
1,450
▲23.3
55,988 Q4
10,815
2.2
10,330
3.5
485
▲18.2
56,171 Oct. 2023
11
10,334
0.1
9,843
2.4
491
▲31.3
56,140 Nov.
12
11,475
4.2
10,561
2.6
915
27.7
56,112 Dec.
2024 年 1月
10,086
1.6
9,618
2.1
468
▲7.8
56,090 Jan. 2024
2
9,768
5.4
9,300
6.1
468
▲6.1
56,029 Feb.
3
10,602
0.4
10,091
1.0
511
▲10.5
55,942 Mar.
4
10,423
0.3
9,945
1.2
478
▲15.3
55,968 Apr.
5
10,773
1.3
10,268
1.2
505
3.7
55,959 May
6
10,670
1.6
10,210
1.7
460
▲2.1
55,946 Jun.
7
11,482
0.7
10,988
1.1
494
▲8.3
55,969 Jul.
8
11,466
0.7
10,979
1.2
487
▲9.9
55,995 Aug.
9
10,682
0.6
10,183
0.5
499
2.6
55,974 Sep.
10
11,030
2.0
10,568
2.3
462
▲4.6
55,976 Oct.
11
10,534
1.9
10,104
2.7
430
▲12.3
55,981 Nov.
12
11,372
▲0.9
10,814
2.4
557
▲39.1
55,988 Dec.
2023 年 10月
注1:既存店の動向は、一般社団法人「日本フランチャイズチェーン協会」の「コンビニエンスストア統計調査月報」
(http://www.jfa-fc.or.jp/particle/320.html)を参照。
注2:前年(度、同期、同月)比増減率は、ギャップを調整するリンク係数(付表参照)で処理した数値で計算している。
Note1:The trends of "Adjusted" items refer to "Convenience store statistics investigation monthly report"
(http://www.jfa-fc.or.jp/particle/320.html) issued by Association of general corporate judicial person Japan franchise chain.
Note2:The percentage change from the same month/term of the previous year is calculated using the linked coefficient
to adjust for discrepancies.Refer to the Appendix table.
7