よむ、つかう、まなぶ。
商業動態統計速報 2022年5月分 (28 ページ)
出典
| 公開元URL | https://www.meti.go.jp/statistics/tyo/syoudou/result/sokuho_2.html |
| 出典情報 | 商業動態統計速報 2022年5月分(6/29)《経済産業省》 |
ページ画像
ダウンロードした画像を利用する際は「出典情報」を明記してください。
低解像度画像をダウンロード
プレーンテキスト
資料テキストはコンピュータによる自動処理で生成されており、完全に資料と一致しない場合があります。
テキストをコピーしてご利用いただく際は資料と付け合わせてご確認ください。
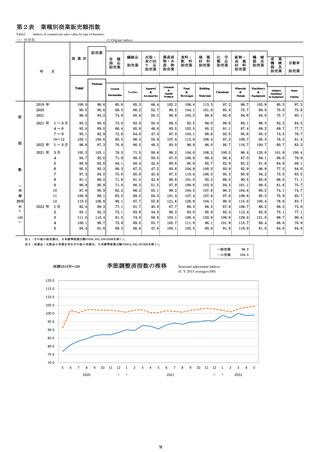
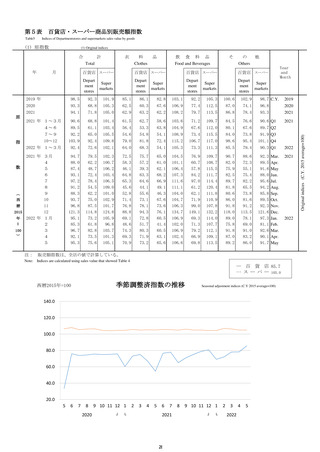
第5表
百貨店・スーパー商品別販売額指数
Indices of Departmentstores and supermarkets sales value by goods
(1) 原指数
(1) Original indices
合
計
衣
料
Clothes
Total
年
原
月
品
飲 食 料 品
Food and Beverages
そ
の
Others
他
百貨店 スーパー
百貨店 スーパー
百貨店 スーパー
百貨店
スーパー
Depart
ment
stores
Depart
ment
stores
Depart
ment
stores
Depart
ment
stores
Super
markets
Super
markets
Super
markets
Super
markets
Year
and
Month
2019 年
98.5
92.3
101.9
85.1
86.1
82.8
103.1
92.2
105.3
100.6
102.9
98.7 C.Y.
2019
2020
93.3
68.8
105.3
62.5
60.3
67.6
106.9
77.4
112.5
87.0
74.1
96.8
2020
2021
94.1
71.8
105.0
62.9
63.2
62.2
108.2
79.7
113.5
86.8
78.4
93.3
2021
90.6
68.8
101.4
61.5
62.7
58.6
103.6
71.2
109.7
84.5
76.6
90.6 Q1
2021
89.5
61.1
103.4
56.4
53.3
63.8
104.9
67.6
112.0
80.1
67.6
89.7 Q2
7~9
92.2
65.0
105.5
54.6
54.8
54.1
108.9
73.4
115.5
84.0
73.8
91.9 Q3
10~12
103.9
92.4
109.8
79.0
81.8
72.4
115.2
106.7
117.0
98.6
95.4
101.1 Q4
92.4
72.6
102.1
64.0
68.3
54.1
105.3
73.3
111.3
85.5
79.4
90.3 Q1
94.7
88.0
87.4
93.1
97.2
91.2
88.3
93.7
96.8
121.3
95.1
85.3
96.7
92.1
95.3
79.5
62.2
48.7
72.4
78.4
54.5
62.2
75.0
87.5
114.8
73.2
61.8
82.8
73.5
75.6
102.3
100.7
106.2
103.4
106.5
109.0
101.0
102.9
101.7
124.8
105.9
96.8
103.7
101.3
105.1
72.5
58.3
46.1
64.8
65.3
45.6
52.8
71.4
76.8
88.8
69.1
48.6
74.3
69.3
70.9
75.7
57.2
39.3
63.3
64.6
44.1
55.6
73.1
78.1
94.3
72.8
51.7
80.3
71.9
73.2
65.0
61.0
62.1
68.2
66.9
49.1
46.3
67.6
73.6
76.1
60.5
41.4
60.5
63.1
65.6
104.5
101.1
106.4
107.3
111.6
111.1
104.0
104.7
106.3
134.7
106.9
102.0
106.9
102.4
106.6
76.9
60.7
57.8
84.2
97.0
61.2
62.1
71.9
99.0
149.1
69.3
71.3
79.2
66.9
69.8
109.7
108.7
115.5
111.7
114.4
120.4
111.8
110.9
107.8
132.2
114.0
107.7
112.1
109.1
113.5
90.7
82.0
75.9
82.5
89.7
81.8
80.6
86.0
91.8
118.0
89.0
75.8
91.8
87.0
89.2
88.6
72.3
55.1
75.4
82.2
65.5
73.8
81.6
91.2
113.5
78.1
69.0
91.0
83.2
86.0
2021 年 1~3月
4~6
指
2022 年 1~3月
(
2021 年 3月
4
数
5
6
7
8
9
西
10
暦
11
2015
12
年
2022 年 1月
=
2
100
3
4
5
)
注:
92.3
89.5
91.6
88.0
95.6
94.2
85.8
89.5
92.3
121.6
97.3
81.1
92.6
90.1
91.7
Mar.
Apr.
May
Jun.
Jul.
Aug.
Sep.
Oct.
Nov.
Dec.
Jan.
Feb.
Mar.
Apr.
May
販売額指数は、全店の値で計算している。
Note: Indices are calculated using sales value that showed Table 4
― 百 貨 店 85.7
… ス ー パ ー 105.0
季節調整済指数の推移
西暦2015年=100
Seasonal adjustment indices (C Y 2015 average=100)
140.0
120.0
100.0
80.0
60.0
40.0
20.0
5
6
7
8
2020
9 10 11 12 1
┘
└
2
3
4
5
6
7
2021
28
8
9 10 11 12 1
┘
└
2
3
2022
4
5
2022
2021
2022
Original indices (C.Y. 2015 average=100)
Table5


