


よむ、つかう、まなぶ。
商業動態統計速報 2022年9月分 (54 ページ)
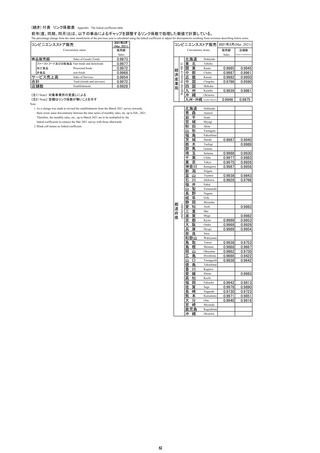
出典
| 公開元URL | https://www.meti.go.jp/statistics/tyo/syoudou/result/sokuho_2.html |
| 出典情報 | 商業動態統計速報 2022年9月分(10/31)《経済産業省》 |
ページ画像
ダウンロードした画像を利用する際は「出典情報」を明記してください。
低解像度画像をダウンロード
プレーンテキスト
資料テキストはコンピュータによる自動処理で生成されており、完全に資料と一致しない場合があります。
テキストをコピーしてご利用いただく際は資料と付け合わせてご確認ください。
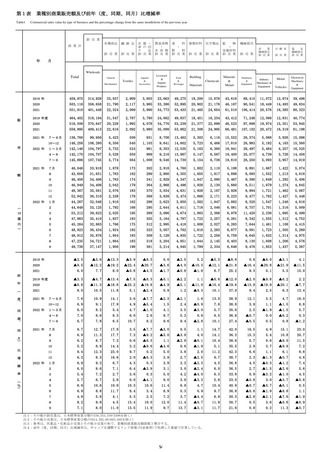
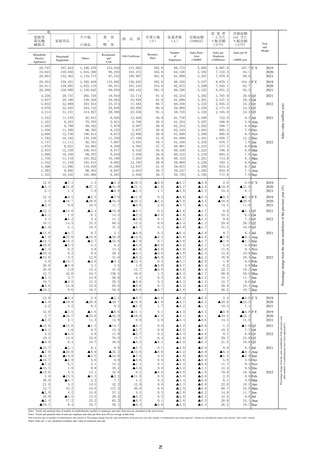
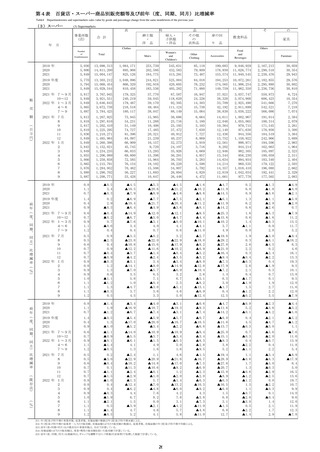
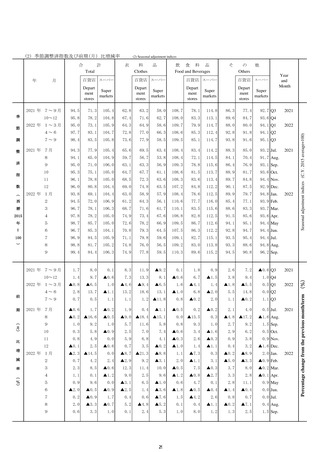
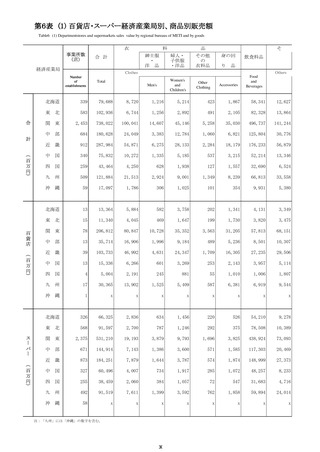
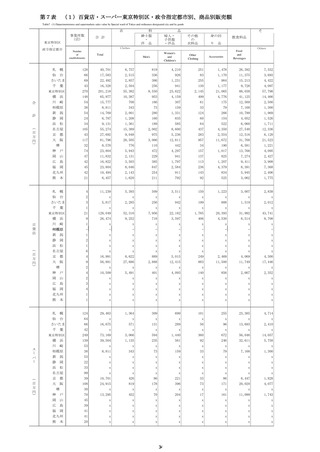
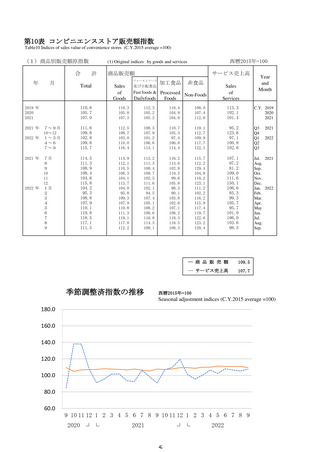
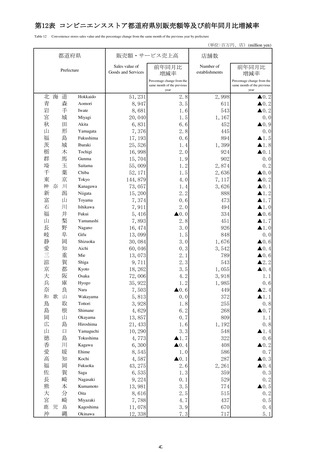
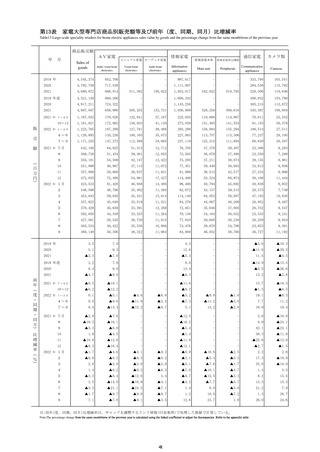
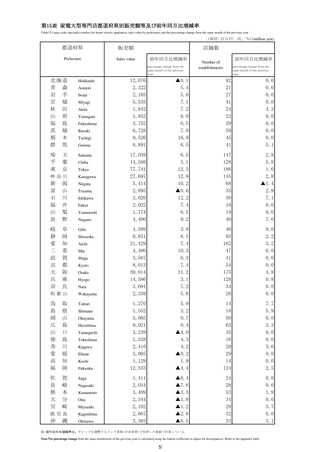
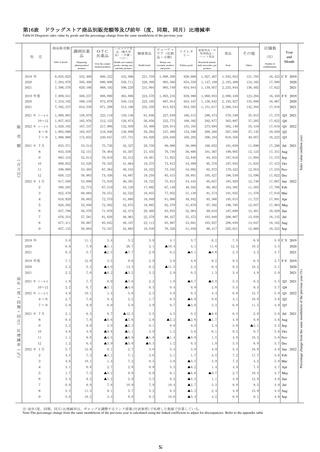
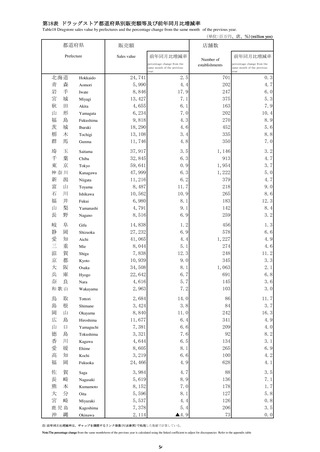
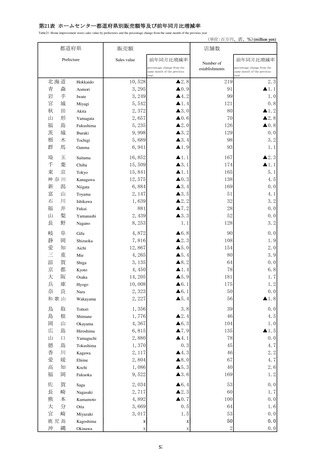
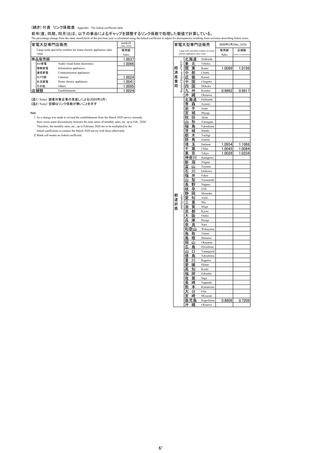
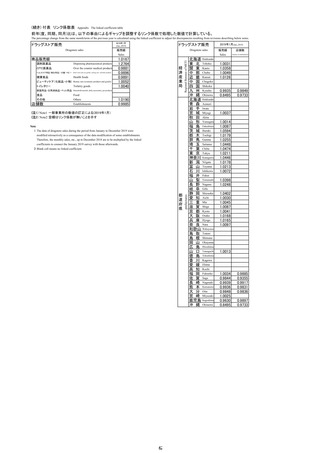
第18表 ドラッグストア都道府県別販売額等及び前年同月比増減率
Table18 Drugstore sales value by prefectures and the percentage change from the same month of the previous year.
(単位:百万円、店、%)(million yen)
都道府県
販売額
Prefecture
Sales value
店舗数
前年同月比増減率
percentage change from the
same month of the previous
year
北海道
青 森
岩 手
宮 城
秋 田
山 形
福 島
茨 城
栃 木
群 馬
Hokkaido
埼
千
東
Saitama
玉
葉
京
Aomori
Iwate
Miyagi
Akita
Yamagata
Fukushima
Ibaraki
Tochigi
Gunma
Chiba
Tokyo
神奈川
Kanagawa
新
富
石
福
山
長
潟
山
川
井
梨
野
Niigata
岐
静
愛
三
滋
京
大
兵
奈
阜
岡
知
重
賀
都
阪
庫
良
Gifu
Toyama
Ishikawa
Fukui
Yamanashi
Nagano
Shizuoka
Aichi
Mie
Shiga
Kyoto
Osaka
Hyogo
Nara
和歌山
Wakayama
鳥
島
岡
広
山
徳
香
愛
高
福
取
根
山
島
口
島
川
媛
知
岡
Tottori
佐
長
熊
大
宮
賀
崎
本
分
崎
Saga
Shimane
Okayama
Hiroshima
Yamaguchi
Tokushima
Kagawa
Ehime
Kochi
Fukuoka
Nagasaki
Kumamoto
Oita
Miyazaki
鹿児島
Kagoshima
沖
Okinawa
縄
Number of
establishments
前年同月比増減率
percentage change from the
same month of the previous
year
24,741
5,990
8,846
13,427
4,655
6,234
9,818
18,290
13,108
11,746
2.5
4.4
17.9
7.1
6.1
7.0
4.3
4.6
3.4
4.8
701
202
247
375
163
202
270
452
335
350
0.3
4.7
6.0
5.3
7.9
10.4
8.9
5.6
8.8
7.0
37,917
32,845
59,641
47,999
11,216
8,487
10,562
6,980
4,791
8,516
3.5
6.3
0.9
6.3
6.2
11.7
10.9
8.1
9.1
6.9
1,146
913
1,954
1,222
379
218
265
183
142
259
3.2
4.7
3.7
5.0
4.7
9.0
8.6
12.3
8.4
3.2
14,838
27,232
41,065
8,044
7,838
10,939
34,508
22,642
4,616
2,963
1.2
6.9
4.4
5.1
12.3
9.0
8.1
6.7
5.7
7.2
456
578
1,227
274
248
345
1,063
691
145
103
1.3
6.6
4.9
4.6
11.2
3.3
2.1
6.8
3.6
3.0
2,684
3,424
8,840
11,677
7,381
3,321
4,644
8,605
3,219
24,466
14.0
3.8
11.0
6.4
6.6
7.6
6.5
8.1
6.6
4.9
86
84
242
341
209
92
134
265
100
628
11.7
3.7
16.3
4.9
4.0
8.2
3.1
6.9
4.2
4.1
3,984
5,619
8,152
5,596
5,537
7,378
2,114
4.7
8.9
7.0
8.1
4.4
5.4
▲4.9
88
136
178
127
126
206
73
3.5
7.1
1.7
5.8
0.8
3.5
0.0
注:前年同月比増減率は、ギャップを調整するリンク係数(付表参照)で処理した数値で計算している。
Note:The percentage change from the same month/term of the previous year is calculated using the linked coefficient to adjust for discrepancies Refer to the appendix table
54