よむ、つかう、まなぶ。
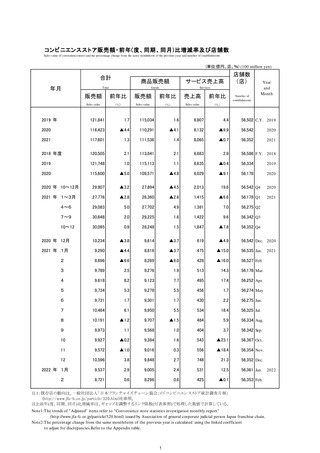
商業動態統計速報 2022年2月分 (53 ページ)
出典
| 公開元URL | https://www.meti.go.jp/statistics/tyo/syoudou/result/sokuho_2.html |
| 出典情報 | 商業動態統計速報 2022年2月分(3/30)《経済産業省》 |
ページ画像
ダウンロードした画像を利用する際は「出典情報」を明記してください。
低解像度画像をダウンロード
プレーンテキスト
資料テキストはコンピュータによる自動処理で生成されており、完全に資料と一致しない場合があります。
テキストをコピーしてご利用いただく際は資料と付け合わせてご確認ください。
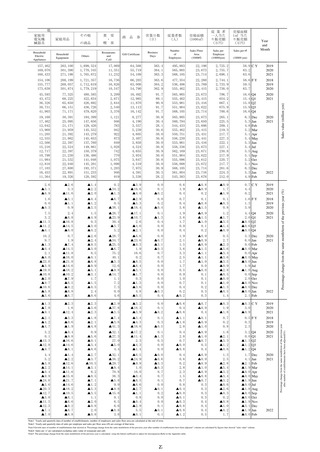
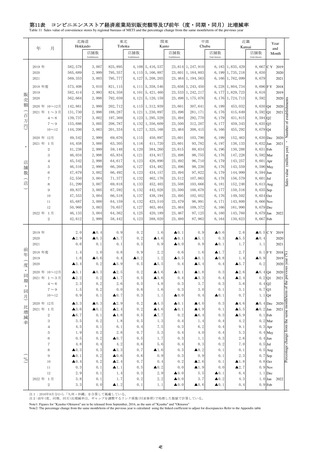
第17表 ドラッグストア経済産業局別販売額等及び前年(度、同期、同月)比増減率
Table17 Drugstore sales value by regional bureaus of METI and the percentage change from the same month/term of the previous year
・
中部
近畿
中国
四国
九州
沖縄
Chubu
Kansai
Chugoku
Shikoku
Kyushu
Okinawa
Year and
month
店舗数
店舗数
店舗数
店舗数
店舗数
店舗数
店舗数
店舗数
店舗数
Establishments
Establishments
Es abl shmen s
Establ shmen s
Establishments
Establishments
Establishments
Es abl shment
Establ shmen s
2019 年
278,259
701 459,297 1,199
2,981,087 7,038
838,113 2,064
1,011,378 2,438
353,077
844 206,275
530 680,424 1,531
27,715
77
C.Y. 2019
2020
286,971
696 508,978 1,284
3,169,802 7,242
926,334 2,215
1,019,867 2,546
390,157
859 223,274
544 731,931 1,536
26,764
78
2020
2021
280,867
706 530,722 1,397
3,178,992 7,468
949,398 2,360
1,027,740 2,695
392,184
898 226,645
572 694,553 1,454
25,477
72
2021
2018 年度
265,867
693 430,979 1,138
2,780,400 6,816
788,542 1,956 972,195 2,350 337,694
823 197,662
509 664,540 1,500
28,789
74
F.Y. 2018
2019
283,490
703 475,334 1,209
3,061,380 7,007
866,335 2,098
1,028,672 2,460
361,440
841 210,851
525 693,948 1,529
28,101
78
2019
2020
281,690
698 509,733 1,306
3,145,548 7,237
927,409 2,245
1,007,062 2,574
390,957
861 223,465
552 722,223 1,419
26,095
75
2020
2020 年 10~12月
70,626
696 126,210 1,284 794,531 7,242 229,842 2,215 253,057 2,546
98,760
859
55,742
544 181,030 1,536
6,511
78
Q4 2020
2021 年 1~3月
67,311
698 123,797 1,306 761,826 7,237 223,890 2,245 241,528 2,574
91,930
861
53,205
552 164,919 1,419
6,117
75
Q1 2021
4~6
70,524
698 133,093 1,332 794,753 7,329 238,308 2,313 258,944 2,631
99,017
874
57,062
553 176,497 1,430
6,719
74
Q2
7~9
73,302
699 140,152 1,364 816,181 7,380 244,133 2,326 262,608 2,648 100,525
892
58,287
559 178,267 1,434
6,628
73
Q3
10~12
69,730
706 133,680 1,397 806,232 7,468 243,067 2,360 264,660 2,695 100,712
898
58,091
572 174,870 1,454
6,013
72
Q4
2020 年 12月
23,819
696
43,570 1,284 282,932 7,242
83,302 2,215
92,533 2,546
36,178
859
20,112
544
65,491 1,536
2,365
78
Dec. 2020
2021 年 1月
24,186
696
42,806 1,288 255,243 7,206
75,865 2,226
80,360 2,555
30,726
861
17,732
539
55,168 1,414
2,030
77
Jan. 2021
2
22,169
696
39,704 1,294 243,106 7,217
73,136 2,232
77,437 2,558
28,712
863
17,030
540
52,023 1,414
1,992
77
Feb.
20,956
698
41,287 1,306 263,477 7,237
74,889 2,245
83,731 2,574
32,492
861
18,443
552
57,728 1,419
2,095
75
Mar.
4
23,426
698
43,551 1,324 259,933 7,278
77,163 2,269
84,705 2,602
32,265
865
18,731
552
58,148 1,422
2,269
75
Apr.
5
22,675
704
43,678 1,329 267,413 7,309
80,295 2,297
87,663 2,614
33,840
870
19,498
553
60,461 1,421
2,242
75
May
(
6
24,423
698
45,864 1,332 267,407 7,329
80,850 2,313
86,576 2,631
32,912
874
18,833
553
57,888 1,430
2,208
74
Jun.
店
7
24,026
697
46,499 1,344 274,984 7,358
81,876 2,319
89,552 2,638
34,627
880
19,523
554
60,113 1,432
2,171
74
Jul.
8
25,135
697
48,256 1,355 279,675 7,364
83,472 2,325
89,293 2,647
34,389
883
20,334
555
60,769 1,432
2,235
73
Aug.
9
24,141
699
45,397 1,364 261,522 7,380
78,785 2,326
83,763 2,648
31,509
892
18,430
559
57,385 1,434
2,222
73
Sep.
10
22,899
704
44,126 1,376 262,055 7,405
79,916 2,342
86,262 2,669
33,461
896
19,264
563
58,083 1,444
1,986
73
Oct.
11
23,011
707
43,456 1,386 258,819 7,439
77,027 2,353
83,214 2,685
31,130
899
17,959
567
54,288 1,447
1,976
72
Nov.
12
23,820
706
46,098 1,397 285,358 7,468
86,124 2,360
95,184 2,695
36,121
898
20,868
572
62,499 1,454
2,051
72
Dec.
23,899
708
45,790 1,402 268,351 7,491
81,282 2,361
88,052 2,707
32,744
902
18,843
570
56,505 1,454
2,034
72
Jan. 2022
23,467
707
43,945 1,406 251,456 7,504
76,404 2,371
82,137 2,721
29,834
903
17,751
570
53,223 1,453
1,868
71
Feb.
2019 年
6.0
1.3
7.9
9.7
5.6
5.0
7.4
6.4
3.9
5.0
6.3
3.8
5.9
3.5
3.9
2.8
2020
3.1 ▲0.7
10.8
7.1
6.3
2.9
10.5
7.3
0.8
4.4
10.5
1.8
8.2
2.6
7.6
0.3
4.3
8.8
0.3
3.1
2.5
6.5
0.8
5.9
0.5
4.5
1.5
5.1
)
3
店
舗
数
2022 年 1月
2
前
年
(
度
・
同
期
・
同
月
)
比
増
減
率
(
%
)
2020
▲4.8 ▲7.7
2021
F.Y. 2018
1.4
2018 年度
4.3
2.7
5.6
9.7
4.9
5.4
6.1
5.7
6.1
4.3
6.4
5.4
6.3
3.5
4.5
4.2
14.1 23.3
2019
6.6
1.4
10.0
6.2
7.2
2.8
9.5
7.3
4.8
4.7
7.0
2.2
6.7
3.1
4.9
1.9
10.5
▲0.6 ▲0.7
7.2
8.0
2.7
3.3
7.0
7.0
▲2.1
4.6
8.2
2.4
6.0
5.1
2020 年 10~12月
0.7 ▲0.7
9.2
7.1
6.5
2.9
8.0
7.3
0.8
4.4
13.8
1.8
10.5
2.6
2021 年 1~3月
▲7.3 ▲0.7
0.6
8.0
▲3.1
3.3
0.5
7.0
▲5.0
4.6
0.9
2.4
0.4
5.1
▲5.6 ▲7.2
2020
C.Y. 2019
1.3
▲2.1
2021
▲5.1 ▲5.3
11.6 11.6
▲3.4
5.4
2019
4.1 ▲7.2
▲7.1 ▲3.8
2020
7.4
▲2.4
0.3
1.3
Q4 2020
▲9.9 ▲3.8
Q1 2021
4~6
▲0.8
0.1
3.8
8.2
0.9
3.6
▲0.4
7.8
1.0
5.9
▲2.1
3.3
▲1.5
4.7
▲6.8 ▲6.8
0.0 ▲3.9
Q2
7~9
0.9
0.7
6.5
9.0
1.8
3.2
4.2
7.0
2.6
5.1
1.4
5.1
3.0
4.5
▲4.6 ▲6.4
▲1.8 ▲8.7
Q3
10~12
▲1.3
1.4
5.9
8.8
1.5
3.1
5.8
6.5
4.6
5.9
2.0
4.5
4.2
5.1
▲3.4 ▲5.3
▲7.6 ▲7.7
Q4
2020 年 12月
1.0 ▲0.7
8.8
7.1
4.7
2.9
8.4
7.3
0.2
4.4
8.9
1.8
7.4
2.6
5.7
0.3
▲2.8
1.3
Dec. 2020
2021 年 1月
▲1.2 ▲0.7
7.5
7.2
2.3
2.2
8.9
7.6
▲2.9
4.7
9.1
1.8
7.1
2.1
0.1 ▲7.5
▲11.3
0.0
2
▲9.6 ▲0.6
▲3.5
7.4
▲9.5
2.3
▲4.4
7.4
▲9.6
4.7
▲7.0
2.1
▲5.2
2.5
▲11.5 ▲7.4
3
▲11.1 ▲0.7
▲1.9
8.0
▲1.7
3.3
▲2.3
7.0
▲2.5
4.6
1.3
2.4
▲0.3
5.1
4
1.1 ▲0.7
1.1
8.3
▲2.0
3.7
▲4.5
7.7
▲1.5
5.6
▲5.0
2.5
▲3.6
4.5
Jan. 2021
▲17.4 ▲1.3
Feb.
▲5.0 ▲7.2
0.5 ▲3.8
Mar.
▲9.9 ▲7.1
▲3.6 ▲5.1
Apr.
5
▲2.0
0.7
5.6
8.0
3.1
3.8
0.3
7.8
2.7
6.1
1.8
3.0
0.8
4.7
▲3.9 ▲7.2
6.8 ▲1.3
May
6
▲1.4
0.1
4.9
8.2
1.6
3.6
3.1
7.8
1.8
5.9
▲2.8
3.3
▲1.6
4.7
▲6.6 ▲6.8
▲2.5 ▲3.9
Jun.
7
▲0.9
0.0
7.1
8.5
1.7
3.2
4.3
7.8
3.4
5.7
3.3
4.0
4.1
5.3
▲3.7 ▲6.6
▲8.0 ▲6.3
Jul.
8
2.3
0.3
5.7
8.7
0.7
3.2
1.7
7.6
▲0.1
5.8
▲0.4
4.4
1.0
4.5
▲5.7 ▲6.6
0.5 ▲8.7
Aug.
Sep.
9
1.3
0.7
6.9
9.0
3.2
3.2
6.8
7.0
4.7
5.1
1.2
5.1
4.0
4.5
▲4.4 ▲6.4
2.5 ▲8.7
10
▲0.8
1.3
7.6
8.7
3.3
3.0
9.5
7.3
7.5
5.5
6.0
5.3
7.6
4.3
▲1.0 ▲5.8
▲2.6 ▲7.6
Oct.
11
▲3.0
1.7
4.4
8.6
0.4
3.1
4.8
6.8
3.6
5.7
0.4
5.0
1.3
4.4
▲4.5 ▲5.9
▲6.2 ▲7.7
Nov.
▲4.6 ▲5.3
▲13.3 ▲7.7
Dec.
12
2022 年 1月
2
0.0
1.4
5.8
8.8
0.9
3.1
3.4
6.5
2.9
5.9
▲0.2
4.5
3.8
5.1
▲1.2
1.7
7.0
8.9
5.1
4.0
7.1
6.1
9.6
5.9
6.6
4.8
6.3
5.8
2.4
2.8
0.2 ▲6.5
5.9
1.6
10.7
8.7
3.4
4.0
4.5
6.2
6.1
6.4
3.9
4.6
4.2
5.6
2.3
2.8
▲6.2 ▲7.8
注:前年(度、同期、同月)比増減率は、ギャップを調整するリンク係数(付表参照)で処理した数値で計算している。
Note:The percentage change from the same month/term of the previous year is calculated using the linked coefficient to adjust for discrepancies Refer to the appendix table
53
Number of establishments
関東
Kanto
Sales value (million yen) ・
販
売
額
(
百
万
円
)
月
東北
Tohoku
Jan. 2022
Feb.
Percentage change from the same month/term of the previous year (%)
年
北海道
Hokkaido


