よむ、つかう、まなぶ。
商業動態統計速報 2022年2月分 (61 ページ)
出典
| 公開元URL | https://www.meti.go.jp/statistics/tyo/syoudou/result/sokuho_2.html |
| 出典情報 | 商業動態統計速報 2022年2月分(3/30)《経済産業省》 |
ページ画像
ダウンロードした画像を利用する際は「出典情報」を明記してください。
低解像度画像をダウンロード
プレーンテキスト
資料テキストはコンピュータによる自動処理で生成されており、完全に資料と一致しない場合があります。
テキストをコピーしてご利用いただく際は資料と付け合わせてご確認ください。
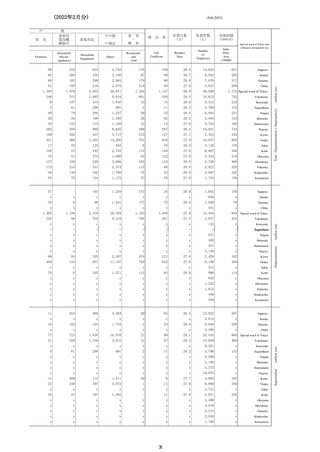
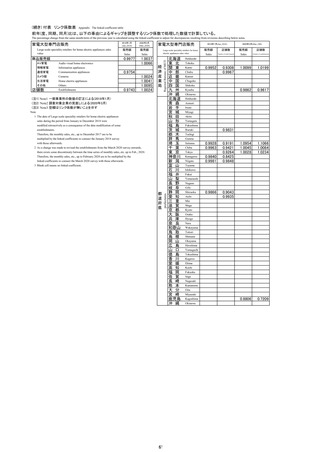
(続き) 付表 リンク係数表
Appendix The linked coefficient table
前年(度、同期、同月)比は、以下の事由によるギャップを調整するリンク係数で処理した数値で計算している。
The percentage change from the same month/term of the previous year is calculated using the linked coefficient to adjust for discrepancies resulting from revisions describing below notes.
Large-scale speciality retailers for home electric appliances sales
value
AV家電
Audio visual home electronics
情報家電
通信家電
Information appliances
Communication appliances
カメラ類
Cameras
生活家電
Home electric appliances
Others
店舗数
2020年3月
(Mar.,2020)
販売額
Sales
販売額
Sales
0.9977
商品販売額
その他
2018年1月
(Jan.,2018)
Establishments
1.0037
1.0066
0.9754
0.9743
1.0024
1.0041
1.0095
1.0024
家電大型専門店販売
Large-scale speciality retailers for home
electric appliances sales value
経
済
産
業
局
Regional Bureaus of METI
家電大型専門店販売
(注1) Note1 一部事業所の数値の訂正による(2018年1月)
(注2) Note2 調査対象企業の見直しによる(2020年3月)
(注3) Note3 空欄はリンク係数が無いことを示す
Note
1 The data of Large-scale speciality retailers for home electric appliances
sales during the period from January to December 2018 were
modified retroactively as a consequence of the data modification of some
establishments.
Therefore, the monthly sales, etc., up to December 2017 are to be
multiplied by the linked coefficients to connect the January 2018 survey
with those afterwards.
2 As a change was made to revised the establishments from the March 2020 survey onwards,
there exists some discontinuity between the time series of monthly sales, etc. up to Feb., 2020.
Therefore, the monthly sales, etc., up to February 2020 are to be multiplied by the
linked coefficients to connect the March 2020 survey with those afterwards.
都
道
府
県
61
prefectures
3 Blank cell means no linked coefficient.
北海道
東 北
関 東
中 部
近 畿
中 国
四 国
九 州
沖 縄
北海道
青 森
岩 手
宮 城
秋 田
山 形
福 島
茨 城
栃 木
群 馬
埼 玉
千 葉
東 京
神奈川
新 潟
富 山
石 川
福 井
山 梨
長 野
岐 阜
静 岡
愛 知
三 重
滋 賀
京 都
大 阪
兵 庫
奈 良
和歌山
鳥 取
島 根
岡 山
広 島
山 口
徳 島
香 川
愛 媛
高 知
福 岡
佐 賀
長 崎
熊 本
大 分
宮 崎
鹿児島
沖 縄
2018年1月(Jan.,2018)
販売額
Sales
店舗数
Number of establ shments
2020年3月(Mar.,200)
販売額
Sales
店舗数
Number of establishments
Hokkaido
Tohoku
Kanto
0.9952
Chubu
0.9308
0.9967
1.0099
1.0199
0.9862
0.9617
1.0954
1.0045
1.0028
1.1066
1.0084
1.0234
0.8806
0.7209
Kansai
Chugoku
Shikoku
Kyushu
Okinawa
Hokkaido
Aomori
Iwate
Miyagi
Akita
Yamagata
Fukushima
Ibaraki
0.9831
Tochigi
Gunma
Saitama
Chiba
0.9928
0.9963
Tokyo
Kanagawa
Niigata
0.9840
0.9981
0.9191
0.9421
0.9264
0.8425
0.9848
Toyama
Ishikawa
Fukui
Yamanashi
Nagano
Gifu
Shizuoka
Aichi
0.9866
0.9043
0.9935
Mie
Shiga
Kyoto
Osaka
Hyogo
Nara
Wakayama
Tottori
Shimane
Okayama
Hiroshima
Yamaguchi
Tokushima
Kagawa
Ehime
Kochi
Fukuoka
Saga
Nagasaki
Kumamoto
Oita
Miyazaki
Kagoshima
Okinawa


