


よむ、つかう、まなぶ。
商業動態統計速報 2023年1月分 (3 ページ)
出典
| 公開元URL | https://www.meti.go.jp/statistics/tyo/syoudou/result/sokuho_2.html |
| 出典情報 | 商業動態統計速報 2023年1月分(2/28)《経済産業省》 |
ページ画像
ダウンロードした画像を利用する際は「出典情報」を明記してください。
低解像度画像をダウンロード
プレーンテキスト
資料テキストはコンピュータによる自動処理で生成されており、完全に資料と一致しない場合があります。
テキストをコピーしてご利用いただく際は資料と付け合わせてご確認ください。
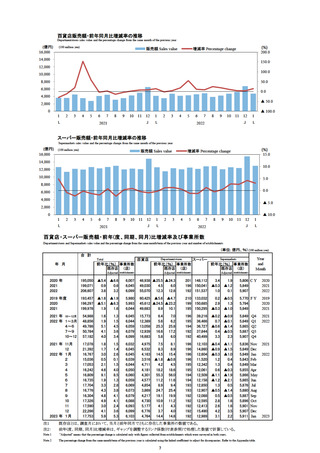
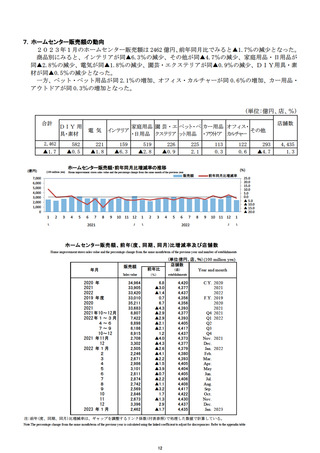
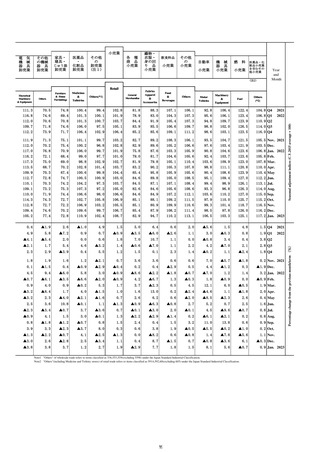
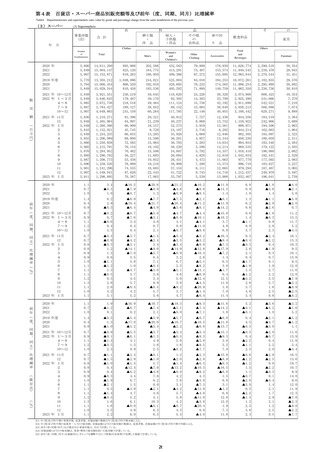
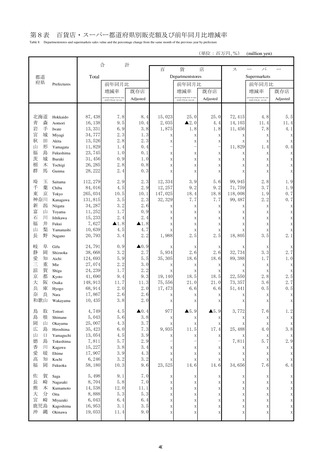
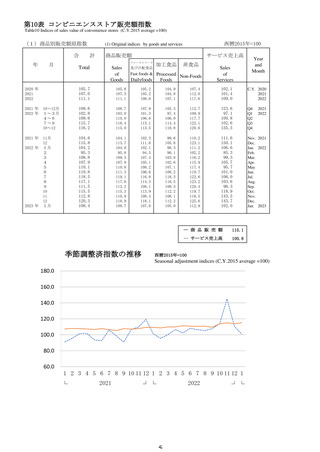
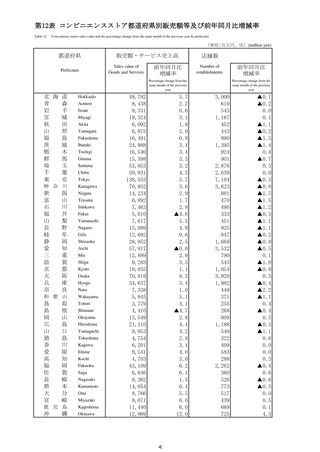
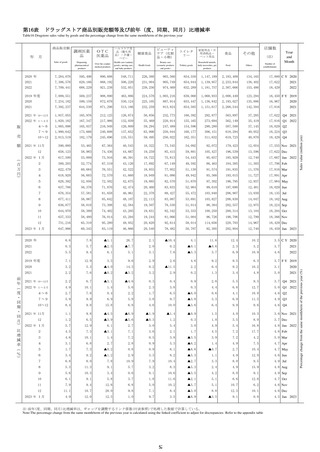
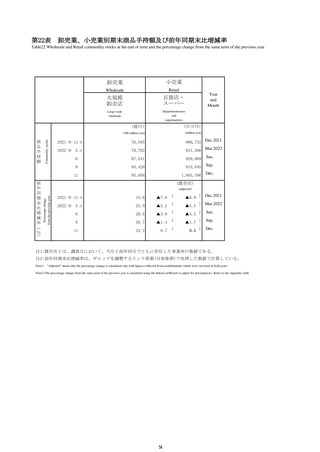
商業販売額の動向
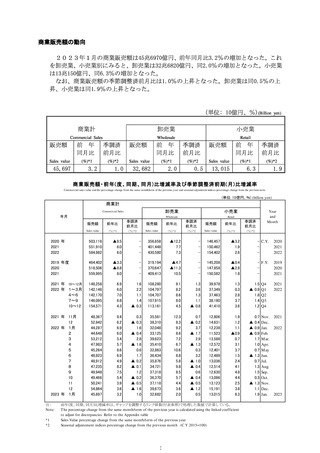
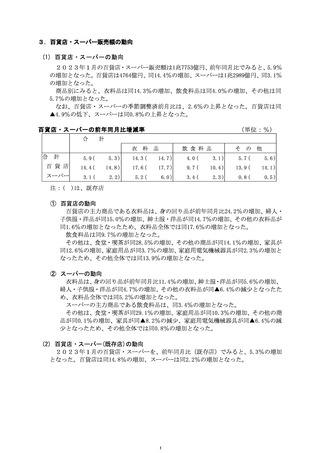
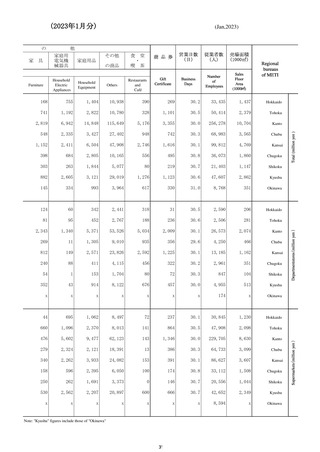
2023年1月の商業販売額は45兆6970億円、前年同月比3.2%の増加となった。これ
を卸売業、小売業別にみると、卸売業は32兆6820億円、同2.0%の増加となった。小売業
は13兆150億円、同6.3%の増加となった。
なお、商業販売額の季節調整済前月比は1.0%の上昇となった。卸売業は同0.5%の上
昇、小売業は同1.9%の上昇となった。
(単位: 10億円、%)(Billion
商業計
卸売業
小売業
Commercial Sales
Wholesale
Retail
販売額
前 年
同月比
Sales value
(%)*1
45,697
3.2
季調済
前月比
(%)*2
1.0
販売額
前 年
同月比
Sales value
季調済
前月比
(%)*1
32,682
(%)*2
2.0
販売額
前 年
同月比
Sales value
0.5
季調済
前月比
(%)*1
13,015
yen)
(%)*2
6.3
1.9
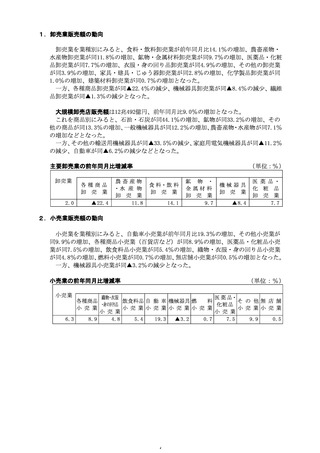
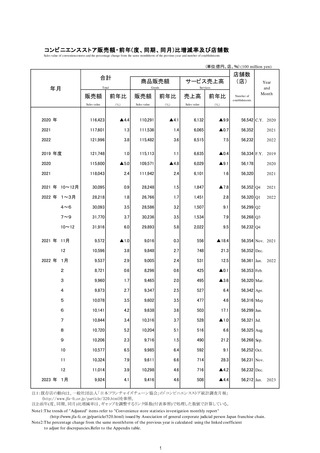
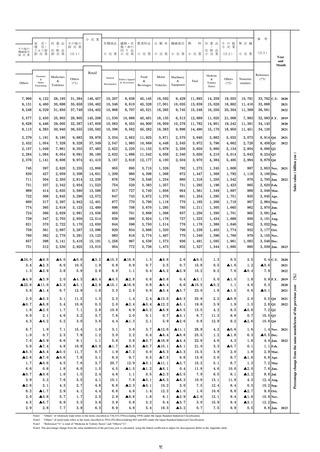
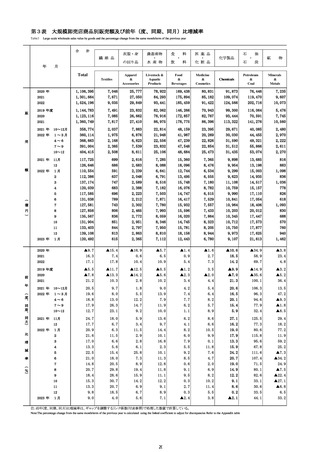
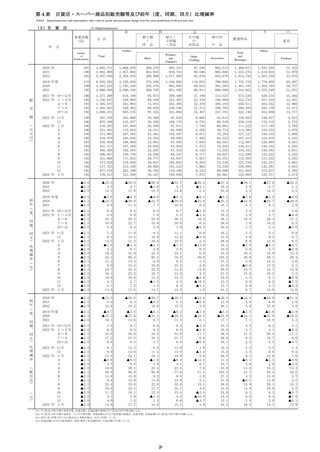
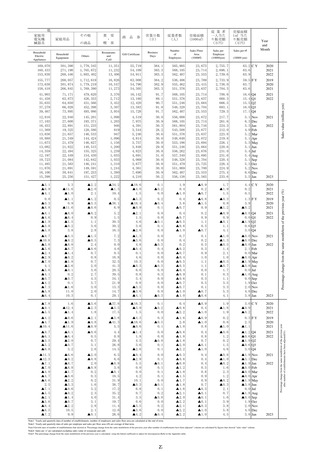
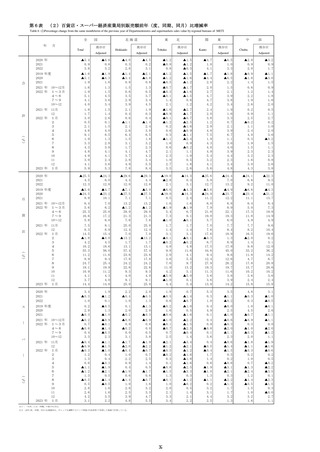
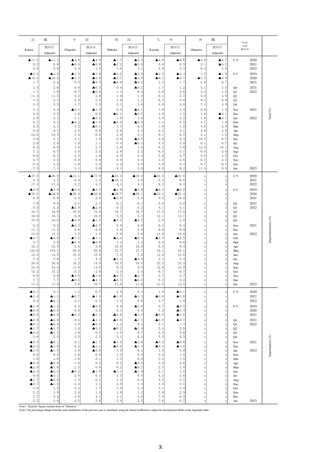
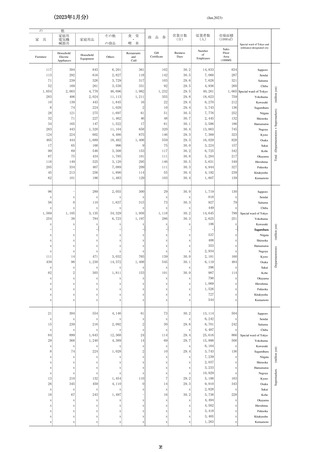
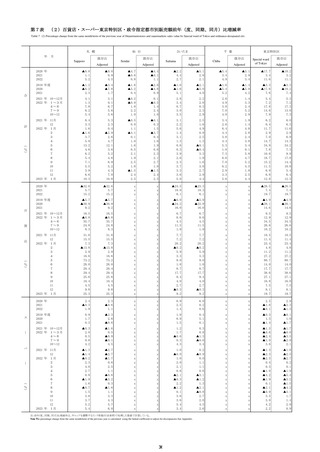
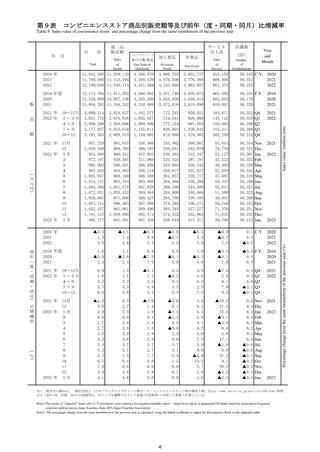
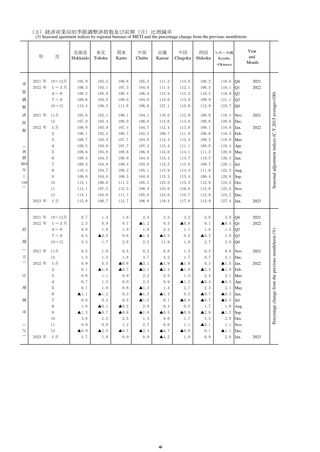
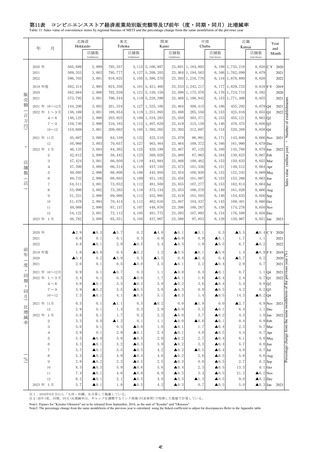
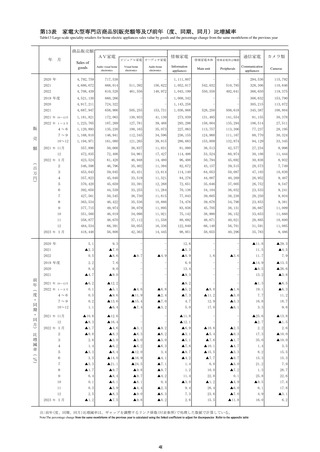
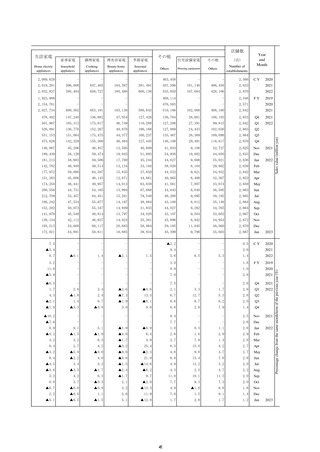
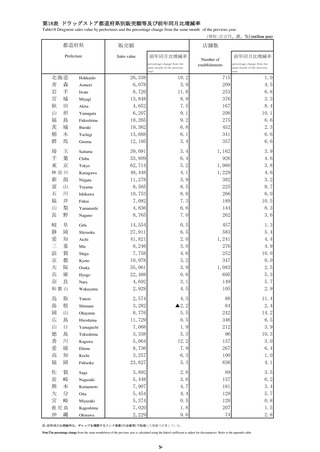
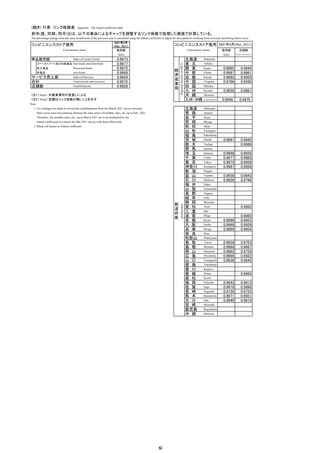
商業販売額・前年(度、同期、同月)比増減率及び季節調整済前期(月)比増減率
Commercial sales value and the percentage change from the same month/term of the previous y ear and seasonal adjustment indices percentage change from the previous term.
(単位: 10億円、%) (billion yen)
商業計
Commercial Sales
年月
小売業
Wholesale
Retail
販売額
前年比
季調済
前月比
販売額
前年比
季調済
前月比
販売額
前年比
季調済
前月比
Sales value
(%)*1
(%)*2
Sales value
(%)*1
(%)*2
Sales value
(%)*1
(%)*2
Year
and
Month
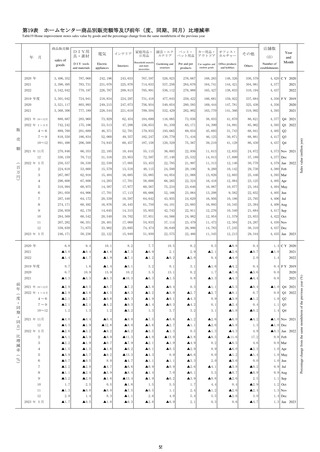
2020 年
2021
2022
503,116
551,910
584,982
▲9.5
6.0
6.0
-
356,658
401,448
430,580
▲12.2
7.7
7.3
-
146,457
150,462
154,402
▲3.2
1.9
2.6
- C.Y.
-
2020
2021
2022
2019 年度
2020
2021
464,402
518,506
559,995
▲3.3
▲8.8
8.0
-
319,194
370,647
409,413
▲4.7
▲11.3
10.5
-
145,208
147,858
150,582
▲0.4
▲2.8
1.8
- F.Y.
-
2019
2020
2021
2021 年 10~12月
2022 年 1~3月
4~6
7~9
10~12
148,258
142,146
142,170
146,095
154,571
6.9
6.0
7.0
6.8
4.3
1.6
2.2
1.1
1.4
▲ 0.3
108,280
104,797
104,707
107,915
113,161
9.1
8.2
8.6
8.0
4.5
1.3
3.6
1.3
1.1
▲ 0.8
39,978
37,349
37,463
38,180
41,410
1.3
0.3
2.8
3.7
3.6
48,367
52,942
44,287
44,648
53,212
47,983
45,264
48,923
48,912
47,235
49,948
49,466
50,241
54,864
45,697
9.4
6.2
6.9
6.0
5.4
5.7
8.6
6.9
4.9
8.2
7.5
5.4
3.9
3.6
3.2
0.3
▲ 0.3
1.6
▲ 0.4
2.8
▲ 1.6
0.6
1.7
▲ 0.2
▲ 0.1
1.2
▲ 0.2
▲ 0.5
▲ 1.6
1.0
35,561
38,310
32,048
33,125
39,623
35,410
32,863
36,434
35,876
34,721
37,318
36,370
37,118
39,673
32,682
12.3
8.3
9.2
8.6
7.2
6.7
10.6
8.8
5.8
9.8
8.5
5.7
4.4
3.6
2.0
0.7
▲ 0.2
3.7
▲ 1.7
2.9
▲ 1.3
0.3
3.2
▲ 1.0
▲ 0.4
0.6
▲ 0.4
▲ 0.5
▲ 1.2
0.5
12,806
14,631
12,238
11,523
13,588
12,572
12,401
12,489
13,036
12,514
12,630
13,096
13,123
15,191
13,015
1.9
1.2
1.1
▲0.9
0.7
3.1
3.7
1.5
2.4
4.1
4.8
4.4
2.5
3.8
6.3
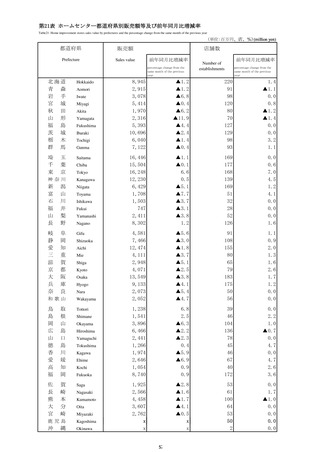
2021 年 11月
12
2022 年 1月
2
3
4
5
6
7
8
9
10
11
12
2023 年 1月
注:
Note:
*1
*2
卸売業
前年(度、同期、同月)比増減率は、ギャップを調整するリンク係数(付表参照)で処理した数値で計算している。
T he percentage change from the same month/term of the previous year is calculated using the linked coefficient
to adjust for discrepancies Refer to the Appendix table
Sales Value percentage change from the same month/term of the previous year
Seasonal adjustement indices percentage change from the previous month (C Y 2015=100)
3
1.5
▲ 0.9
1.8
1.4
1.2
Q4
Q1
Q2
Q3
Q4
0.7 Nov.
▲ 0.4 Dec.
▲ 0.9 Jan.
▲ 0.9 Feb.
1.7 M ar.
1.0 Apr.
0.7 M ay
▲ 1.3 Jun.
0.7 Jul.
1.3 Aug.
1.5 Sep.
0.3 Oct.
▲ 1.3 Nov.
1.1 Dec.
1.9 Jan.
2021
2022
2021
2022
2023
2023年1月の商業販売額は45兆6970億円、前年同月比3.2%の増加となった。これ
を卸売業、小売業別にみると、卸売業は32兆6820億円、同2.0%の増加となった。小売業
は13兆150億円、同6.3%の増加となった。
なお、商業販売額の季節調整済前月比は1.0%の上昇となった。卸売業は同0.5%の上
昇、小売業は同1.9%の上昇となった。
(単位: 10億円、%)(Billion
商業計
卸売業
小売業
Commercial Sales
Wholesale
Retail
販売額
前 年
同月比
Sales value
(%)*1
45,697
3.2
季調済
前月比
(%)*2
1.0
販売額
前 年
同月比
Sales value
季調済
前月比
(%)*1
32,682
(%)*2
2.0
販売額
前 年
同月比
Sales value
0.5
季調済
前月比
(%)*1
13,015
yen)
(%)*2
6.3
1.9
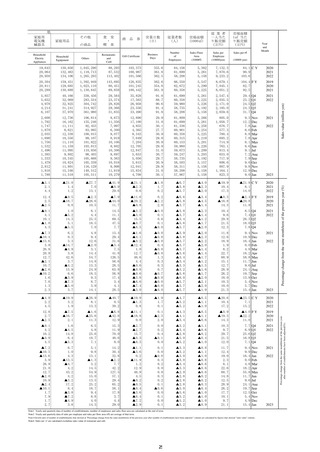
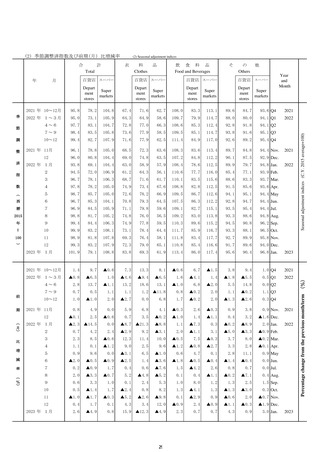
商業販売額・前年(度、同期、同月)比増減率及び季節調整済前期(月)比増減率
Commercial sales value and the percentage change from the same month/term of the previous y ear and seasonal adjustment indices percentage change from the previous term.
(単位: 10億円、%) (billion yen)
商業計
Commercial Sales
年月
小売業
Wholesale
Retail
販売額
前年比
季調済
前月比
販売額
前年比
季調済
前月比
販売額
前年比
季調済
前月比
Sales value
(%)*1
(%)*2
Sales value
(%)*1
(%)*2
Sales value
(%)*1
(%)*2
Year
and
Month
2020 年
2021
2022
503,116
551,910
584,982
▲9.5
6.0
6.0
-
356,658
401,448
430,580
▲12.2
7.7
7.3
-
146,457
150,462
154,402
▲3.2
1.9
2.6
- C.Y.
-
2020
2021
2022
2019 年度
2020
2021
464,402
518,506
559,995
▲3.3
▲8.8
8.0
-
319,194
370,647
409,413
▲4.7
▲11.3
10.5
-
145,208
147,858
150,582
▲0.4
▲2.8
1.8
- F.Y.
-
2019
2020
2021
2021 年 10~12月
2022 年 1~3月
4~6
7~9
10~12
148,258
142,146
142,170
146,095
154,571
6.9
6.0
7.0
6.8
4.3
1.6
2.2
1.1
1.4
▲ 0.3
108,280
104,797
104,707
107,915
113,161
9.1
8.2
8.6
8.0
4.5
1.3
3.6
1.3
1.1
▲ 0.8
39,978
37,349
37,463
38,180
41,410
1.3
0.3
2.8
3.7
3.6
48,367
52,942
44,287
44,648
53,212
47,983
45,264
48,923
48,912
47,235
49,948
49,466
50,241
54,864
45,697
9.4
6.2
6.9
6.0
5.4
5.7
8.6
6.9
4.9
8.2
7.5
5.4
3.9
3.6
3.2
0.3
▲ 0.3
1.6
▲ 0.4
2.8
▲ 1.6
0.6
1.7
▲ 0.2
▲ 0.1
1.2
▲ 0.2
▲ 0.5
▲ 1.6
1.0
35,561
38,310
32,048
33,125
39,623
35,410
32,863
36,434
35,876
34,721
37,318
36,370
37,118
39,673
32,682
12.3
8.3
9.2
8.6
7.2
6.7
10.6
8.8
5.8
9.8
8.5
5.7
4.4
3.6
2.0
0.7
▲ 0.2
3.7
▲ 1.7
2.9
▲ 1.3
0.3
3.2
▲ 1.0
▲ 0.4
0.6
▲ 0.4
▲ 0.5
▲ 1.2
0.5
12,806
14,631
12,238
11,523
13,588
12,572
12,401
12,489
13,036
12,514
12,630
13,096
13,123
15,191
13,015
1.9
1.2
1.1
▲0.9
0.7
3.1
3.7
1.5
2.4
4.1
4.8
4.4
2.5
3.8
6.3
2021 年 11月
12
2022 年 1月
2
3
4
5
6
7
8
9
10
11
12
2023 年 1月
注:
Note:
*1
*2
卸売業
前年(度、同期、同月)比増減率は、ギャップを調整するリンク係数(付表参照)で処理した数値で計算している。
T he percentage change from the same month/term of the previous year is calculated using the linked coefficient
to adjust for discrepancies Refer to the Appendix table
Sales Value percentage change from the same month/term of the previous year
Seasonal adjustement indices percentage change from the previous month (C Y 2015=100)
3
1.5
▲ 0.9
1.8
1.4
1.2
Q4
Q1
Q2
Q3
Q4
0.7 Nov.
▲ 0.4 Dec.
▲ 0.9 Jan.
▲ 0.9 Feb.
1.7 M ar.
1.0 Apr.
0.7 M ay
▲ 1.3 Jun.
0.7 Jul.
1.3 Aug.
1.5 Sep.
0.3 Oct.
▲ 1.3 Nov.
1.1 Dec.
1.9 Jan.
2021
2022
2021
2022
2023