よむ、つかう、まなぶ。
商業動態統計速報 (17 ページ)
出典
| 公開元URL | https://www.meti.go.jp/statistics/tyo/syoudou/result/sokuho_2.html |
| 出典情報 | 商業動態統計速報 2022年3月分(4/28)《経済産業省》 |
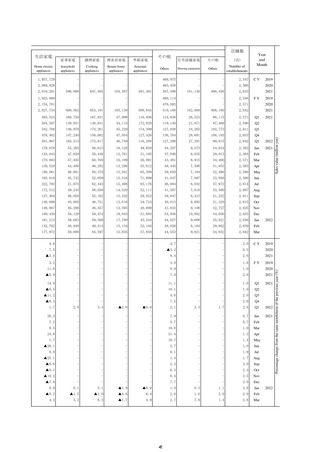
ページ画像
ダウンロードした画像を利用する際は「出典情報」を明記してください。
低解像度画像をダウンロード
プレーンテキスト
資料テキストはコンピュータによる自動処理で生成されており、完全に資料と一致しない場合があります。
テキストをコピーしてご利用いただく際は資料と付け合わせてご確認ください。
その他
の機械
器 具
卸売業
家具・
建具・
じゅう器
卸売業
医薬品
・
化粧品
卸売業
その他
の
卸売業
(注1)
各 種
商 品
小売業
織物・
衣服・
身の回
り 品
小売業
飲食料品
小売業
その他
の
小売業
自動車
小売業
機 械
器 具
小売業
燃
料
小売業
医薬品・化
粧品小売業
を含むその
他小売業
(注2)
Retail
Electorical
Machinery
& Equipment
Others
Furniture
& House
Furnishings
Medicines
&
Toiletries
General
Merchandise
Others(*1)
Fabrics
Apparel
&
Accessories
Food
&
Beverages
Others
Motor
Vehicles
Machinery
&
Equipment
Fuel
Year
and
Month
Others
(*2)
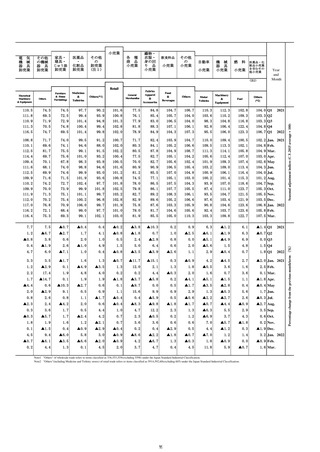
109.3
96.7
111.2
91.2
69.4
71.8
82.9
75.5
73.8
100.3
94.3
99.9
91.2
85.8
94.8
103.1
99.7
101.6
92.2
77.8
78.5
102.1
85.0
85.7
103.7
105.1
105.9
104.8
102.4
105.2
108.5
99.0
101.4
104.7
107.5
108.2
107.5
97.4
112.8
103.9 C.Y. 2019
104.4
2020
103.8
2021
113.9
106.3
111.3
113.2
120.0
77.1
66.7
71.9
71.7
76.6
74.9
71.2
70.2
78.8
69.8
92.3
100.6
100.3
106.5
95.5
89.7
92.9
93.7
103.0
98.9
100.6
98.5
99.4
108.0
101.0
75.8
71.9
74.2
92.1
77.3
80.9
82.8
73.7
105.6
81.1
100.1
104.3
107.8
111.5
99.7
107.4
101.8
102.5
109.3
108.1
120.9
96.3
96.2
92.4
106.0
115.7
102.1
104.2
110.8
109.7
108.2
104.8
109.7
128.4
129.4
100.8
102.9
102.3
109.2
103.5
99.1
104.9
137.6
105.9
97.2
115.7
112.2
102.1
119.5
107.1
112.0
120.5
106.5
110.8
142.6
62.7
66.7
101.8
70.2
61.3
68.6
68.8
67.2
79.6
67.4
70.3
77.4
67.1
69.0
93.8
62.7
72.3
89.6
78.4
63.3
71.8
73.1
65.5
72.0
72.8
78.8
84.8
60.2
66.9
82.4
86.1
87.3
103.4
111.8
89.6
100.5
100.8
98.1
101.9
102.4
102.3
114.8
91.8
91.5
103.2
82.3
84.4
102.3
97.4
87.3
94.0
94.0
88.6
98.5
100.2
103.2
105.5
89.8
93.6
113.3
98.1
94.2
109.4
98.8
96.9
99.7
103.1
97.5
97.7
101.6
103.8
118.6
99.2
93.4
110.4
75.5
69.8
82.0
71.4
66.1
78.2
82.7
69.3
70.6
79.3
86.9
110.0
79.7
68.6
83.5
84.7
64.4
93.6
80.9
81.5
85.9
82.9
65.2
72.9
95.3
106.9
114.7
88.0
62.1
93.1
100.1
95.5
104.8
102.4
106.4
104.2
107.9
110.1
105.3
106.9
104.2
123.4
99.4
94.9
104.8
102.5
101.4
118.4
103.7
99.0
102.7
106.6
99.5
101.3
103.5
106.1
118.2
103.7
100.6
120.1
106.3
114.5
141.9
98.8
90.0
100.1
100.2
89.9
98.4
84.3
94.9
97.9
88.3
97.2
132.5
116.4
102.9
127.7
102.7
102.4
101.2
114.6
100.5
97.4
104.3
102.5
125.7
111.3
94.6
123.3
105.0
104.4
115.3
107.8
100.6
105.9
113.9
107.9
107.2
119.3
124.5
141.5
128.9
126.4
132.8
98.3
95.2
108.8
104.8
102.4
101.5
104.4
101.4
101.1
106.6
104.9
116.1
102.6
96.3
111.6
Note1 "Other" ot wholesale trade refers to the items classified as 536,553,559(excluding 5598) under the Japan Standard Industrial Classification.
Note2 "Others"(including Medicine and Toiletry stores) of retail trade refers to items classified as 5914,592,60(excluding 605) under the Japan Standard Industrial Classification.
17
Q1 2021
Q2
Q3
Q4
Q1 2022
Jan. 2021
Feb.
Mar.
Apr.
May
Jun.
Jul.
Aug.
Sep.
Oct.
Nov.
Dec.
Jan. 2022
Feb.
Mar.
Original Indices ( C.Y.2015 average = 100 )
小売業
電 気
機 械
器 具
卸売業


