よむ、つかう、まなぶ。
商業動態統計速報 (20 ページ)
出典
| 公開元URL | https://www.meti.go.jp/statistics/tyo/syoudou/result/sokuho_2.html |
| 出典情報 | 商業動態統計速報 2022年3月分(4/28)《経済産業省》 |
ページ画像
ダウンロードした画像を利用する際は「出典情報」を明記してください。
低解像度画像をダウンロード
プレーンテキスト
資料テキストはコンピュータによる自動処理で生成されており、完全に資料と一致しない場合があります。
テキストをコピーしてご利用いただく際は資料と付け合わせてご確認ください。
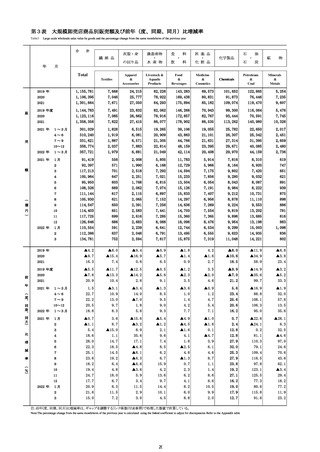
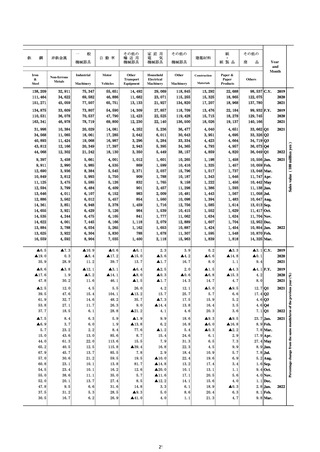
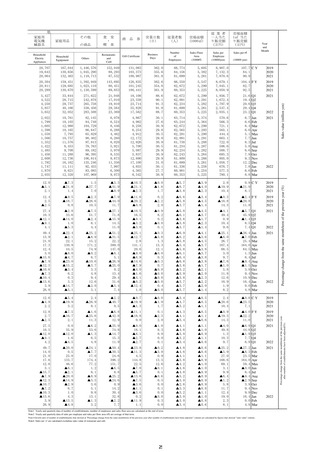
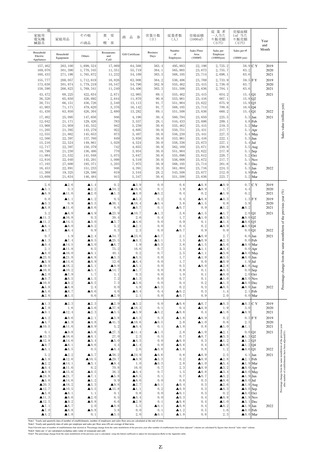
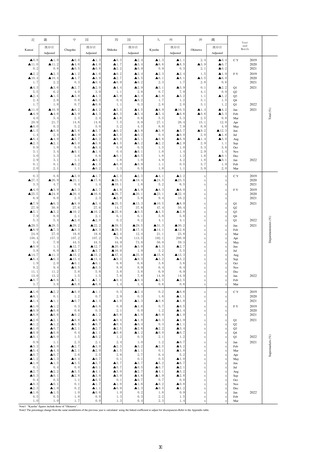
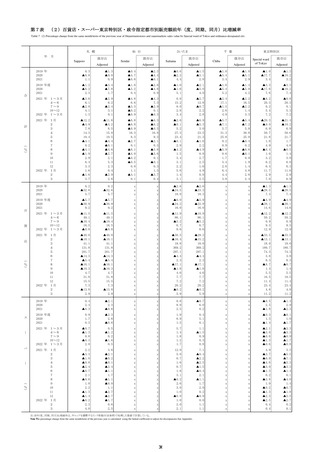
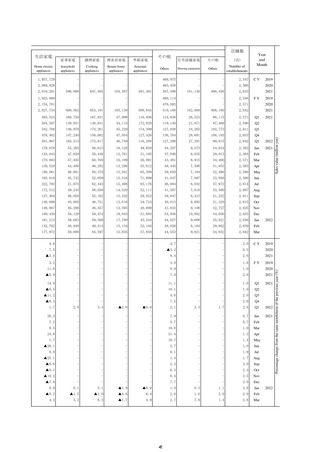
第3表
Table3
大規模卸売店商品別販売額及び前年(度、同期、同月)比増減率
Large-scale wholesale sales value by goods and the percentage change from the same month/term of the previous year
合
計
衣服・身
の回り品
農畜産物
・
水 産 物
Apparel
&
Accessories
Livestock &
Aquatic
Products
繊 維 品
年
Textiles
2019 年
2020
2021
2019 年度
2020
2021
2021 年
1~3月
4~6
7~9
売
10~12
2022 年
1~3月
2021 年
1月
2
額
3
4
5
6
7
(
8
億
9
円
10
)
11
12
2022 年
1月
2
3
2019 年
2020
2021
2019 年度
前
年
(
度
、
同
期
、
同
月
)
2020
2021
2021 年
1~3月
4~6
7~9
10~12
2022 年
1~3月
2021 年
1月
2
3
比
4
増
5
6
減
7
8
率
9
(
%
)
10
11
12
2022 年
料
化学製品
料
医 薬 品
・
化 粧 品
Food
&
Beverages
Medicine
&
Cosmetics
Chemicals
・
飲
石
油
鉱
・
石
物
炭
月
Total
販
食
1月
2
3
Petroleum
&
Coal
Minerals
&
Metals
1,155,781
1,106,395
1,301,664
7,668
7,046
7,671
24,215
25,777
27,050
82,226
78,922
84,293
143,283
169,438
175,894
69,573
80,831
85,182
101,652
91,873
109,074
122,865
76,446
119,470
5,254
7,235
9,607
1,144,783
1,123,116
1,358,356
7,491
7,085
7,822
23,832
26,662
27,415
82,062
78,916
86,077
146,266
172,857
178,902
70,943
82,767
86,535
99,300
93,444
113,262
116,064
70,591
140,980
5,476
7,745
10,326
301,029
310,240
331,621
358,774
357,721
1,828
1,919
1,887
2,037
1,979
6,515
6,081
6,571
7,883
6,881
19,265
20,909
21,305
22,814
21,049
39,106
43,863
44,766
48,159
42,114
19,055
21,101
21,631
23,395
20,408
25,782
26,307
27,314
29,671
29,970
22,650
25,342
31,395
40,085
44,159
2,017
2,451
2,659
2,480
2,736
91,419
92,397
117,213
105,964
95,950
108,326
111,144
105,930
114,547
114,403
117,725
126,646
110,554
112,386
134,781
556
571
701
647
603
669
617
621
650
651
699
686
591
637
752
2,008
1,990
2,518
2,251
1,768
2,062
2,115
2,065
2,391
2,583
2,616
2,683
2,239
2,048
2,594
5,805
6,168
7,292
7,021
6,815
7,074
6,897
7,152
7,256
7,441
7,285
8,088
6,641
6,791
7,617
11,783
12,729
14,594
15,233
13,504
15,126
15,833
14,297
14,636
14,703
15,360
18,096
12,744
13,495
15,875
5,914
5,966
7,175
7,856
6,054
7,191
7,407
6,956
7,269
7,554
7,365
8,476
6,534
6,555
7,319
7,816
8,164
9,802
9,280
8,043
8,984
9,212
8,878
9,224
9,819
9,898
9,954
9,299
9,623
11,048
8,310
6,920
7,420
9,032
8,087
8,222
10,731
11,110
9,553
13,202
13,685
13,198
15,003
14,935
14,221
619
747
651
621
891
939
875
898
886
781
816
883
1,098
836
802
▲4.2
▲9.7
16.3
▲8.0
▲15.4
7.4
▲9.4
▲16.9
0.6
▲0.9
▲5.7
6.5
▲1.8
▲1.4
0.9
4.2
▲1.6
2.7
▲8.0
▲10.6
18.5
▲11.9
▲34.9
58.9
▲6.8
▲3.8
23.4
▲5.5
▲7.8
20.9
▲11.7
▲13.3
10.4
▲12.5
▲14.2
2.8
▲0.5
▲5.6
9.1
▲1.2
▲2.3
3.5
3.5
▲2.0
4.6
▲9.9
▲7.0
21.2
▲14.9
▲35.6
99.7
▲3.2
▲5.2
33.3
1.5
22.7
22.2
20.5
18.8
▲3.1
10.9
13.0
9.7
8.3
▲3.4
14.0
▲7.0
1.8
5.6
▲1.3
8.5
9.5
9.0
9.3
▲3.6
1.0
1.4
4.2
7.7
▲0.9
1.2
4.7
5.4
7.1
5.6
23.4
25.6
20.6
16.2
▲16.9
88.8
108.1
106.3
95.0
▲1.9
32.0
57.8
13.5
35.6
▲0.7
▲1.1
5.4
18.6
28.0
22.3
25.1
23.6
18.2
19.4
24.7
17.7
20.9
21.6
15.0
3.6
8.7
▲15.0
1.1
14.7
18.5
14.5
19.2
6.4
4.8
18.0
6.7
6.3
11.5
7.2
▲15.6
▲3.2
8.9
35.6
17.1
▲4.8
▲8.1
▲6.3
▲6.6
▲3.6
5.9
3.4
11.5
2.9
3.0
▲5.4
▲1.2
2.1
9.6
7.4
8.5
6.2
6.7
15.9
4.2
13.6
9.7
14.4
10.1
4.5
▲4.9
▲4.5
▲1.6
4.1
1.8
▲2.5
4.8
▲1.3
0.7
2.3
6.2
4.1
8.2
6.0
8.8
▲1.0
▲1.8
0.1
▲4.7
3.9
6.1
4.6
8.7
1.1
1.4
8.6
6.6
10.5
9.9
2.0
0.7
2.4
12.8
12.8
27.9
32.0
25.3
27.9
23.8
19.2
27.1
16.2
19.0
17.9
12.7
▲22.6
▲24.1
0.2
81.1
110.3
79.1
109.4
116.5
97.8
123.1
125.5
77.3
80.6
115.8
91.6
▲28.1
6.3
32.5
▲4.6
97.0
24.6
70.6
43.6
62.1
▲3.4
29.4
18.2
77.2
11.9
23.2
注:前年(度、同期、同月)比増減率は、ギャップを調整するリンク係数(付表参照)で処理した数値で計算している。
Note:The percentage change from the same month/term of the previous year is calculated using the linked coefficient to adjust for discrepancies Refer to the Appendix table
20


