よむ、つかう、まなぶ。
商業動態統計速報 (50 ページ)
出典
| 公開元URL | https://www.meti.go.jp/statistics/tyo/syoudou/result/sokuho_2.html |
| 出典情報 | 商業動態統計速報 2022年3月分(4/28)《経済産業省》 |
ページ画像
ダウンロードした画像を利用する際は「出典情報」を明記してください。
低解像度画像をダウンロード
プレーンテキスト
資料テキストはコンピュータによる自動処理で生成されており、完全に資料と一致しない場合があります。
テキストをコピーしてご利用いただく際は資料と付け合わせてご確認ください。
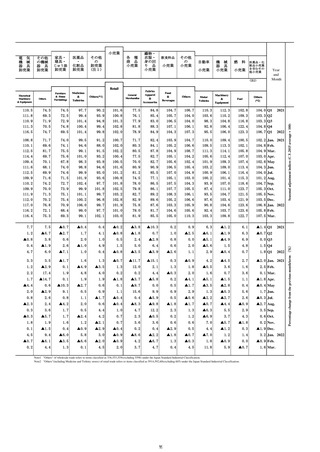
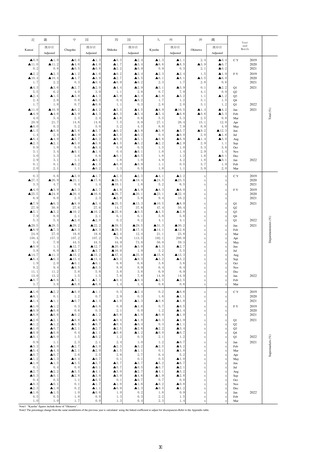
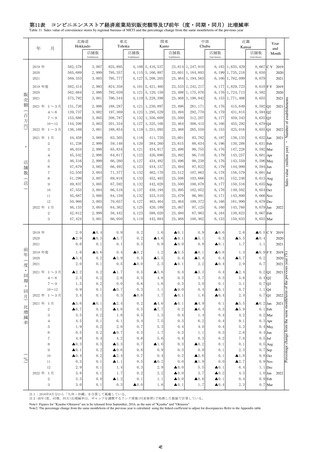
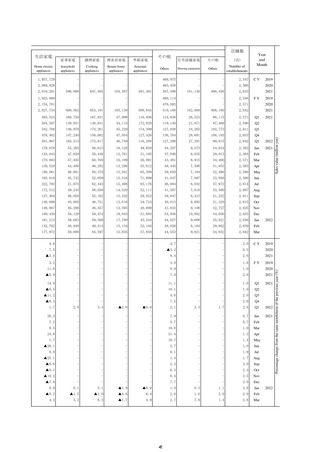
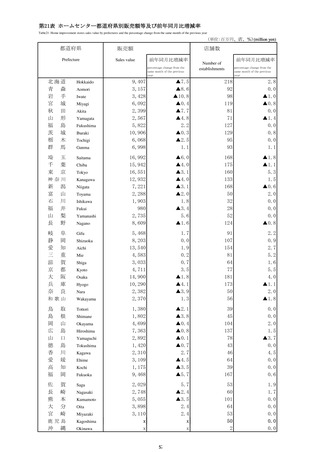
第14表 家電大型専門店経済産業局別販売額等及び前年(度、同期、同月)比増減率
Table14 Large-scale speciality retailers for home electric appliances sales value by regional bureaus of METI and the percentage change from the same month/term of the previous year
近畿
中国
四国
九州
沖縄
Hokkaido
Tohoku
Kanto
Chubu
Kansai
Chugoku
Shikoku
Kyushu
Okinawa
店舗数
店舗数
店舗数
店舗数
Establishments
Es ablishments
Establishments
Es abl shmen s
63,737
54,944
57,692
56,493
61,227
173
173
174
174
175
578,785
940
951
542,149 953
566,142 964
582,727 964
114,174
310
311
112,892 312
110,401 317
114,986 319
225,699
540,693
102,864
202,181
455
458
222,585 467
226,616 471
228,290 473
66,942
57,360
64,173
62,391
65,754
175
176
176
177
178
13,544
11,305
14,874
11,541
11,519
11,682
14,709
12,672
12,092
11,815
11,839
14,720
12,845
10,337
15,988
92
92
92
92
92
91
92
92
92
91
92
92
92
92
92
23,699
17,938
22,100
17,405
18,930
18,609
22,143
18,944
16,605
17,650
17,030
21,813
23,248
16,066
21,913
175
175
173
173
173
173
174
174
174
174
173
174
174
174
175
205,012
937
939
940
947
952
951
956
951
953
955
958
964
964
965
964
40,387
32,224
41,563
31,256
36,507
35,101
43,502
35,553
33,837
32,373
33,432
44,596
40,077
32,033
42,876
78,596
63,290
83,813
65,326
63,345
73,510
85,840
68,631
68,114
64,564
68,476
93,576
77,494
64,275
86,521
22,969
18,889
25,084
17,222
19,436
20,702
24,158
19,919
20,096
17,894
19,168
25,329
21,606
18,477
25,671
176
175
175
175
176
176
176
176
176
176
176
177
178
178
178
155,961
2021
151,759
1~3月
4~6
2
3
4
5
6
(
7
店
8
)
9
10
11
12
2022 年 1月
2
3
2019 年
2020
2021
2019 年度
2020
2021
1~3月
4~6
7~9
10~12
2022 年
店舗数
Establishments
92
91
92
92
92
149,070
2020
2021 年
店舗数
Establ shmen s
39,723
34,742
7~9 39,473
10~12 38,374
1~3月
39,170
2019 年度
店
舗
数
店舗数
Establishments
2,108,797
152,312
2022 年
店舗数
Es abl shmen s
92 223,621 174
92 242,028 173
92 230,356 175
2021
2021 年
店舗数
2,114,507
152,909
1~3月
2021 年 1月
2
3
4
5
6
7
8
9
10
11
12
2022 年 1月
2
3
Year and
month
Establishments
92 222,656 176
92 237,092 175
92 232,866 174
150,545
2020
・
(
%
)
中部
2019 年
2021 年 1月
前
年
(
度
・
同
期
・
同
月
)
比
増
減
率
関東
2,275,248
2,227,769
2,339,220
2,231,711
167,740
206,033
172,290
190,127
178,276
204,336
172,551
165,262
170,860
170,974
224,308
203,069
167,928
211,730
906 446,106 313 879,895 464 249,679 174 100,853
938 458,986 313 898,291 455 260,276 177 106,955
964 440,331 317 877,081 471 250,866 177 105,427
87 346,217 312 34,916
87 366,114 304 36,888
87 355,301 319 44,719
23
25
32
C.Y. 2019
924 440,957 310 871,726 460 247,938 174 100,298
940 467,925 310 917,381 455 267,152 175 110,666
964 441,143 319 879,672 473 249,678 178 104,455
87 344,170 302 34,553
88 377,710 306 39,168
88 353,336 321 45,837
23
32
32
F Y 2019
28,051
24,555
26,994
25,827
27,079
88
88
87
87
88
95,021
85,727
89,294
85,259
93,056
306
310
318
319
321
10,358
12,263
11,780
10,318
11,476
32
32
32
32
32
Q1 2021
9,914
8,029
10,108
7,303
8,753
8,499
10,262
8,765
7,967
7,412
7,772
10,643
9,292
7,763
10,024
87
88
88
88
88
88
88
88
87
87
87
87
88
88
88
33,440
27,353
34,228
26,726
29,910
29,091
32,878
28,985
27,431
25,255
26,115
33,889
32,052
26,476
34,528
304
304
306
308
309
310
318
318
318
318
319
319
319
320
321
3,293
2,596
4,469
3,795
4,475
3,993
4,367
3,716
3,697
3,273
3,084
3,961
3,841
3,243
4,392
25
25
32
32
32
32
32
32
32
32
32
32
32
32
32
Jan 2021
312
311
310
311
311
311
312
311
312
315
317
317
317
318
319
455
455
455
457
457
458
466
465
467
467
471
471
472
472
473
2020
2021
2020
2021
Q2
Q3
Q4
Q1 2022
Feb
Mar.
Apr
May
Jun
Jul
Aug.
Sep
Oct
Nov.
Dec
Jan 2022
Feb
Mar.
4.7 1.1
1.6 0.0
▲0.4 0.0
3.5 1.1
6.5 ▲0.6
▲1.8 ▲0.6
3.1 2.8
6.7 1.5
▲2.2 2.8
2.5 2.3
2.9 0.0
▲4.1 1.3
5.6 1.8
2.1 ▲1.9
▲2.4 3.5
3.3 1.2
4.2 1.7
▲3.6 0.0
1.5 0.0
6.1 0.0
▲1.4 0.0
2.2 1.0
7.0 1.3
▲2.8 4.9
4.3 4.5
5.6 8.7
21.2 28.0
C.Y. 2019
2.8 1.1
4.6 0.0
▲2.7 0.0
3.8 0.0
8.2 ▲0.6
▲4.8 1.2
1.9 2.1
9.9 1.7
▲4.6 2.6
0.8 1.0
6.1 0.0
▲5.7 2.9
3.7 1.1
5.2 ▲1.1
▲4.1 4.0
2.0 1.2
7.7 0.6
▲6.5 1.7
1.1 0.0
10.3 1.1
▲5.6 0.0
1.8 4.5
11.1 1.3
▲6.5 4.9
2.9 4.5
13.4 39.1
17.0 0.0
F Y 2019
8.3
▲4.7
3.1
▲7.6
▲1.4
8.4
▲4.0
▲3.9
▲7.4
▲3.9
▲0.6
8.5
▲8.9
▲7.9
▲6.7
0.7
9.2
▲6.0
▲8.2
▲3.2
1.1
11.4
▲8.3
▲8.4
▲7.7
▲1.8
15.2
▲8.4
▲5.7
▲5.0
▲3.5
14.9
▲6.7
▲8.6
▲8.4
▲2.1
28.2
15.0
21.4
22.3
10.8
39.1
33.3
28.0
28.0
0.0
Q1 2021
2.6
13.4
11.2
17.3
▲1.1
▲20.0
6.9
▲13.4
▲4.8
1.4
▲13.0
▲9.2
▲1.9
▲10.4
▲0.8
0.6
0.6
1.6
11.6 0.6
8.0 ▲1.5
15.3 1.7
22.5 0.0
17.0 1.0
21.4 8.7
1.6
3.6 0.3
4.7 ▲1.3
5.7 0.6
10.1 1.1
14.5 1.0
13.2 8.7
1.7
9.6 0.0
14.3 ▲1.1
12.6 0.6
12.9 1.1
13.3 1.3
45.4 39.1
2.4
6.7 0.3
14.7 ▲1.3
4.5 0.0
8.6 1.1
16.5 2.3
58.5 39.1
2.6 ▲1.4 0.0 ▲10.0 ▲1.3 ▲1.2 0.6
0.9 1.1
0.1 2.3
22.1 39.1
1.9 ▲24.6 0.3 ▲16.3 ▲1.3 ▲21.6 0.0 ▲25.4 1.1 ▲25.6 2.0 ▲13.3 33.3
2.6 ▲1.0 0.0 ▲2.0 0.4 ▲2.0 0.0 ▲0.7 1.1 ▲7.2 4.6
21.6 33.3
2.3 ▲18.0 ▲0.3 ▲19.0 0.4 ▲20.5 0.0 ▲16.4 1.1 ▲18.6 4.6
13.8 28.0
2.5 ▲4.1 0.0 ▲2.9 1.3 ▲1.2 0.0
2.2 0.0
2.6 5.0
29.9 28.0
2.7
2.3 1.0
4.6 2.9
3.0 0.0
2.4 0.0 ▲0.3 5.0
34.2 28.0
2.5 ▲10.1 1.3 ▲6.6 3.7 ▲11.6 ▲0.6 ▲6.3 0.0 ▲11.1 4.9
18.5 28.0
2.8 ▲9.8 1.3 ▲5.5 3.5 ▲11.4 0.0 ▲8.8 0.0 ▲11.6 4.9
16.6 28.0
2.9 ▲0.8 1.6 ▲1.4 3.7 ▲5.9 1.1 ▲6.3 1.1 ▲4.2 4.9
16.6 28.0
2.8 ▲0.6 2.3
1.6 3.7 ▲2.2 1.7 ▲3.3 0.0 ▲3.2 5.3
24.9 28.0
2.6
3.2 2.9
3.2 4.0
2.3 1.7 ▲0.8 0.0
0.9 4.9 ▲1.7 0.0
Jan 2021
0.8
10.3
14.5
15.8
1.4
▲22.7
14.5
▲4.4
▲0.8
▲0.4
▲13.4
▲7.9
▲5.2
▲8.6
7.5
0.0
▲1.1
0.0
0.0
0.0
0.0
0.0
0.0
0.0
0.0
▲1.1
0.0
0.0
0.0
▲1.1
0.0
0.0
0.0
0.0
0.0
11.7
▲1.0
0.0 ▲10.4
▲0.6 ▲7.1
1.2
0.7
▲0.6
▲0.6
▲0.6
▲0.6
▲0.6
0.0
0.0
0.0
0.0
▲1.1
▲0.6
▲0.6
▲0.6
1.2
12.8
7.0
14.7
16.6
5.8
▲18.5
▲5.5
▲19.6
▲5.2
0.8
▲12.2
▲8.4
▲0.9
0.1
2.8
1.7
1.9
2.5
2.8
2.6
0.0
0.3
0.0
1.3
2.9
▲1.1
▲1.3
1.3
3.5
4.0
0.6
0.0
0.0
0.0
1.7
1.1
1.1
0.0
0.0
0.0
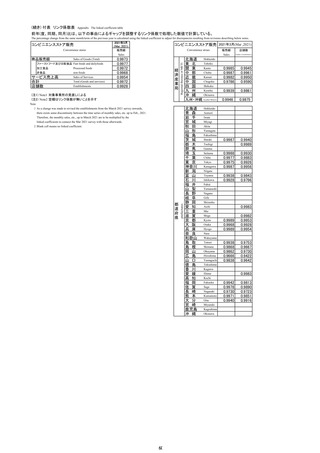
注:前年(度、同期、同月)比増減率は、ギャップを調整するリンク係数(付表参照)で処理した数値で計算している。
Note:The percentage change from the same month/term of the previous year is calculated using the linked coefficient to adjust for discrepancies Refer to the appendix table
50
1.3
2.0
5.0
4.9
4.9
Sales value (million yen) ・ Number of establishments
販
売
額
(
百
万
円
)
月
東北
2020
2021
2020
2021
Q2
Q3
Q4
Q1 2022
Feb
Mar.
Apr
May
Jun
Jul
Aug.
Sep
Oct
Nov.
Dec
Jan 2022
Feb
Mar.
Percentage change from the same month/term of the previous year (%)
年
北海道


