よむ、つかう、まなぶ。
参考資料15 COVID-19 vaccine safety update; Primary series in young children and booster doses in older children and adults, ACIP September 1, 2022 (25 ページ)
出典
| 公開元URL | https://www.mhlw.go.jp/stf/shingi2/0000208910_00052.html |
| 出典情報 | 第85回厚生科学審議会予防接種・ワクチン分科会副反応検討部会、令和4年度第14回薬事・食品衛生審議会薬事分科会医薬品等安全対策部会安全対策調査会(合同開催)(10/7)《厚生労働省》 |
ページ画像
ダウンロードした画像を利用する際は「出典情報」を明記してください。
低解像度画像をダウンロード
プレーンテキスト
資料テキストはコンピュータによる自動処理で生成されており、完全に資料と一致しない場合があります。
テキストをコピーしてご利用いただく際は資料と付け合わせてご確認ください。
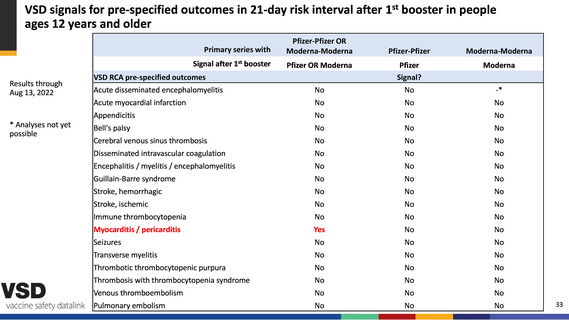
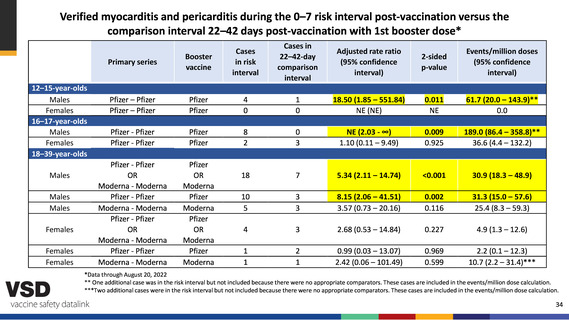
VAERS reporting rates of verified myocarditis per 1 million mRNA COVID-19 vaccinations
(Pfizer-BioNTech and Moderna combined), days 0–7 post-vaccination*,†
Dose 2
(primary series)
Age group
Male
Female
5–11 years
12–15 years
16–17 years
18–24 years
25–29 years
30–39 years
40–49 years
50–64 years
65+ years
2.5
47.1
78.7
39.3
15.3
7.8
3.3
0.7
0.3
0.7
4.2
7.4
3.9
3.5
1.0
1.6
0.5
0.5
1st booster
dose
Male
Female
0.0
12.9
21.6
13.1
4.4
1.9
0.2
0.4
0.7
From
previous
slide
0.0
0.7
0.0
0.6
2.2
0.9
0.6
0.1
0.2
* As of August 18, 2022. Reports verified to meet case definition by provider interview or medical record review.
†
An estimated 1–10 cases of myocarditis per 100,000 person years occurs among people in the United States, regardless of vaccination status; adjusted for days 0–7
risk interval, this estimated background is 0.2 to 2.2 per 1 million person-day 0–7 risk interval (peach shaded cells indicate that reporting rate exceeded estimated
background incidence for the period)
25


