よむ、つかう、まなぶ。
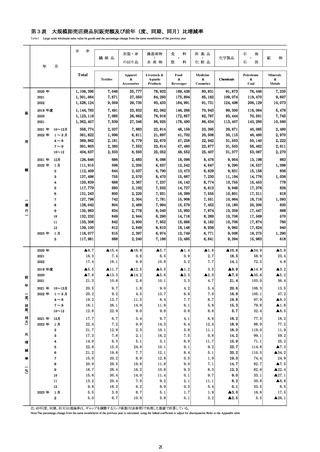
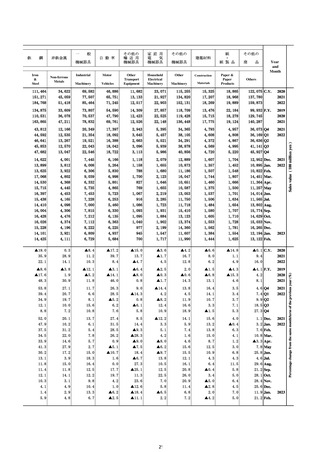
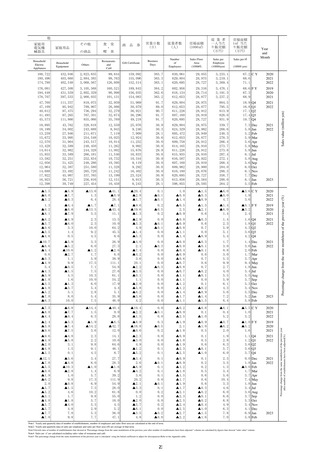
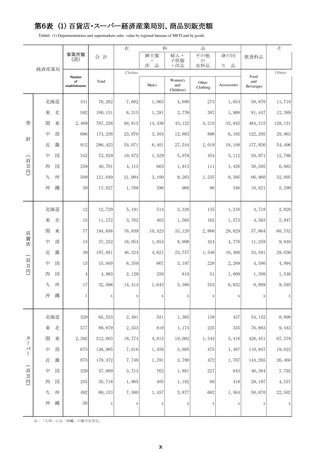
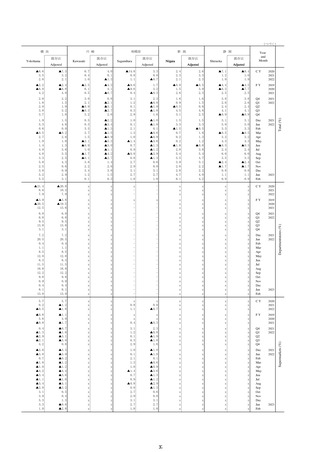
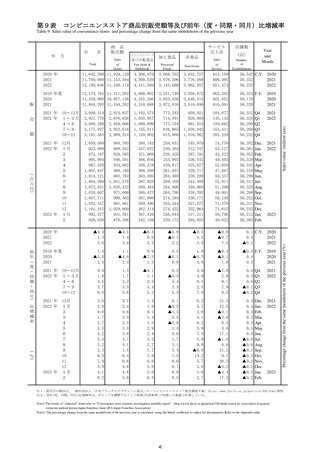
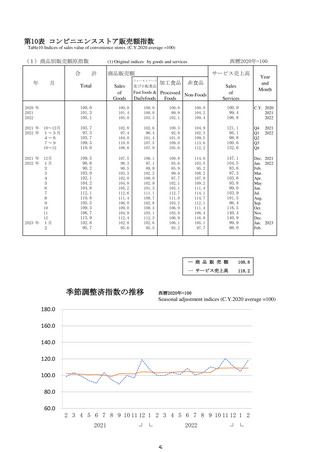
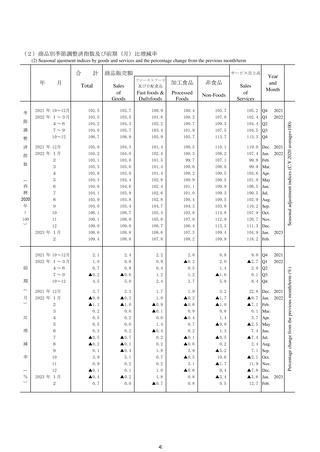
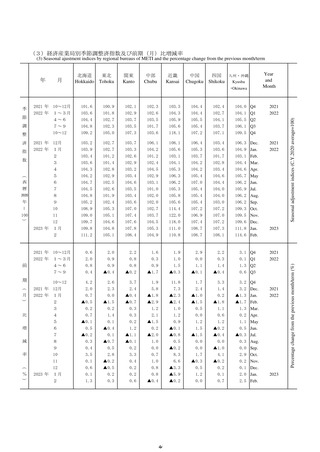
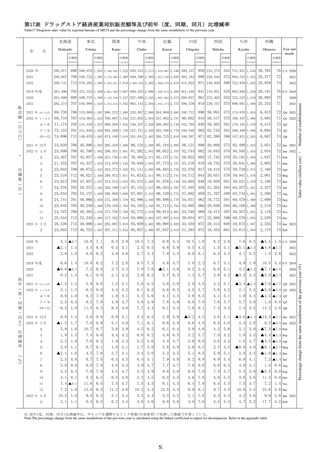
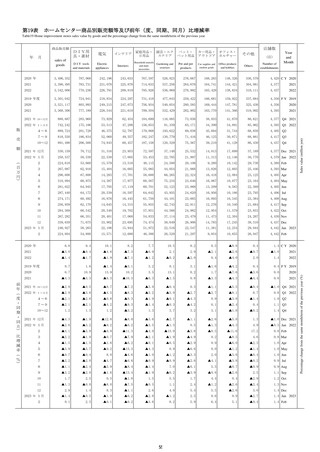
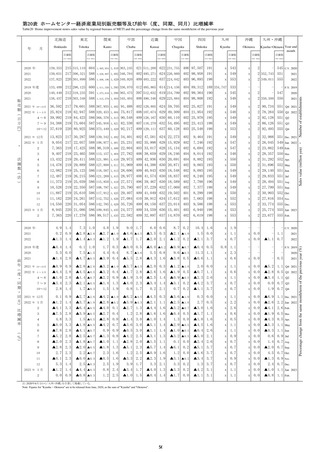
商業動態統計速報 2023年2月分 (15 ページ)
出典
| 公開元URL | https://www.meti.go.jp/statistics/tyo/syoudou/result/sokuho_2.html |
| 出典情報 | 商業動態統計速報 2023年2月分(3/31)《経済産業省》 |
ページ画像
ダウンロードした画像を利用する際は「出典情報」を明記してください。
低解像度画像をダウンロード
プレーンテキスト
資料テキストはコンピュータによる自動処理で生成されており、完全に資料と一致しない場合があります。
テキストをコピーしてご利用いただく際は資料と付け合わせてご確認ください。
参
小 売 業
医 薬 品
・
化 粧 品
卸 売 業
その他の
卸 売 業
各種商品
(注1)
小 売 業
織物・衣
服・身の
回 り 品
小 売 業
飲食料品
自 動 車
機械器具
燃
料
小 売 業
小 売 業
小 売 業
小 売 業
そ の 他
小 売 業
無 店 舗
(注2)
小 売 業
考
(注3)
Year
and
Month
Medicines
&
Toiletries
General
Others
(*1)
Merchandise
Fabrics Apparel
& Accessories
Food
&
Beverages
Motor
Vehicles
Machinery
&
Equipment
Fuel
Medicine
&
Toiletry
Stores
Others
(*2)
Nonstore
retailers
Reference
(*3)
7,966
4,122
28,193
31,384
146,457
10,207
8,638
45,145
16,592
9,429
11,893
14,259
19,503
10,791
33,762 C.Y. 2020
9,131
4,460
30,698
35,658
150,462
10,346
8,610
45,328
17,001
10,035
13,839
15,026
18,862
11,416
33,888
2021
9,248
4,329
31,850
37,749
154,402
10,968
8,707
45,521
16,285
9,745
15,248
16,256
20,304
11,369
36,561
2022
5,577
2,430
25,903
28,905
145,208
11,530
10,686
45,401
18,135
6,513
12,889
11,025
21,068
7,963
8,628
4,446
29,005
32,387
147,858
10,063
8,353
44,900
16,959
10,276
11,782
14,901
19,242
11,381
34,143
2020
9,113
4,383
30,940
36,555
150,582
10,396
8,562
45,282
16,383
9,898
14,490
15,170
18,950
11,451
34,120
2021
2,279
1,191
8,180
9,683
39,978
3,034
2,652
11,925
3,871
2,570
3,940
3,882
5,032
3,073
8,914 Q4
2021
2,432
1,054
7,328
9,328
37,349
2,547
1,983
10,669
4,448
2,545
3,972
3,796
4,662
2,728
8,458 Q1
2022
2,157
1,049
7,861
9,355
37,463
2,622
2,220
11,132
3,679
2,356
3,650
3,866
5,134
2,804
9,000 Q2
2,284
1,084
8,054
9,091
38,180
2,632
1,886
11,542
4,058
2,340
3,656
4,210
5,014
2,843
9,224 Q3
2,376
1,141
8,608
9,974
41,410
3,167
2,618
12,177
4,100
2,504
3,970
4,384
5,495
2,994
9,879 Q4
820
427
2,939
3,308
14,631
1,209
960
4,398
1,368
972
1,447
1,368
1,792
1,118
3,160 Dec. 2021
711
304
2,350
2,814
12,238
876
736
3,546
1,234
860
1,318
1,250
1,542
876
2,793 Jan. 2022
731
337
2,342
2,934
11,523
754
520
3,383
1,357
731
1,292
1,196
1,423
865
2,620 Feb.
989
414
2,635
3,580
13,588
917
727
3,740
1,856
954
1,361
1,349
1,697
988
3,046 Mar.
722
368
2,845
3,290
12,572
847
743
3,672
1,276
801
1,254
1,295
1,751
935
3,045 Apr.
660
317
2,397
2,942
12,401
877
770
3,790
1,118
770
1,185
1,266
1,718
907
2,984 May
774
365
2,619
3,123
12,489
898
708
3,670
1,285
785
1,211
1,305
1,665
962
2,970 Jun.
724
366
2,629
2,991
13,036
950
701
3,868
1,368
837
1,256
1,390
1,701
965
3,091 Jul.
739
347
2,703
2,930
12,514
838
588
3,924
1,176
727
1,223
1,434
1,668
936
3,101 Aug.
821
370
2,722
3,170
12,630
844
596
3,750
1,514
776
1,178
1,386
1,646
942
3,032 Sep.
759
361
2,697
3,267
13,096
929
834
3,866
1,320
798
1,239
1,403
1,774
932
3,177 Oct.
760
382
2,770
3,291
13,123
983
816
3,774
1,407
770
1,240
1,396
1,760
979
3,155 Nov.
857
398
3,141
3,416
15,191
1,256
967
4,538
1,373
936
1,491
1,585
1,961
1,083
3,546 Dec.
734
309
2,526
2,889
12,851
949
766
3,725
1,366
831
1,318
1,348
1,681
865
3,030 Jan. 2023
772
354
2,454
3,009
12,282
832
571
3,554
1,565
738
1,289
1,306
1,550
876
2,856 Feb.
▲24.0
▲9.0
▲6.0
▲6.0
▲3.2
▲15.5
▲16.8
1.3
▲8.8
2.6
▲9.5
1.3
0.5
3.5
3.4
▲2.3
6.0
10.5
1.9
0.8
0.9
0.7
2.5
0.7
15.8
0.5
▲1.6
1.2
▲0.6
2021
1.3
▲2.9
3.8
5.9
2.6
6.0
1.1
0.4
▲4.2
▲2.9
10.2
8.2
7.6
▲0.4
7.9
2022
32,093 F.Y. 2019
0.4 C.Y. 2020
▲4.9
▲3.9
2.0
▲4.3
▲0.4
▲4.5
▲2.8
0.6
▲0.8
0.4
▲3.1
5.0
▲1.0
1.8
▲22.6
▲11.0
▲5.3
▲5.1
▲2.8
▲15.1
▲16.6
0.8
▲6.4
6.6
▲10.5
▲0.2
1.1
4.6
0.3
2020
5.6
▲1.4
6.7
12.9
1.8
3.3
2.5
0.9
▲3.4
▲3.7
23.0
1.8
▲1.5
0.6
▲0.1
2021
0.9 F.Y. 2019
2.0
▲0.3
3.1
11.5
1.3
2.3
1.4
2.4
▲13.5
▲6.3
25.9
2.2
▲0.8
2.0
0.5 Q4
2021
▲0.7
▲6.8
3.4
10.6
0.3
2.0
▲2.4
▲0.4
▲12.2
▲5.1
19.6
3.9
1.9
1.3
2.8 Q1
2022
1.8
▲2.5
1.7
7.1
2.8
10.6
6.9
▲0.2
▲8.8
▲0.5
13.5
4.2
9.5
▲0.8
7.2 Q2
0.0
2.1
4.6
3.2
3.7
7.6
2.0
0.1
0.7
▲3.1
8.7
11.3
9.8
0.7
10.5 Q3
4.3
▲4.2
5.2
3.0
3.6
4.4
▲1.3
2.1
5.9
▲2.6
0.8
12.9
9.2
▲2.6
1.0
0.7
2.3
7.9
1.2
3.0
2.2
0.4
▲8.4
▲8.8
23.5
1.2
▲1.8
6.3
▲0.5 Dec. 2021
7.0
▲3.9
6.6
9.1
1.1
5.6
3.8
▲0.7
▲16.9
▲4.4
22.8
4.6
4.3
1.8
4.4 Jan. 2022
3.6
▲7.4
4.8
10.9
▲0.9
▲1.7
▲3.5
▲0.7
▲15.1
▲8.1
21.0
3.3
▲0.7
0.1
1.1 Feb.
▲8.3
▲8.4
▲0.5
11.7
0.7
1.9
▲7.2
0.0
▲6.3
▲3.3
15.5
3.9
2.0
1.9
2.9 Mar.
▲2.8
▲7.0
▲0.6
7.8
3.1
8.0
9.7
0.5
▲7.5
0.8
13.8
3.0
9.7
▲1.6
6.8 Apr.
1.7
▲0.6
4.5
7.6
3.7
20.7
12.9
▲0.1
▲11.1
▲2.7
15.2
5.1
8.7
1.3
7.2 May
6.6
0.8
1.8
6.0
1.5
4.5
▲1.5
▲1.2
▲8.1
0.4
11.8
4.6
10.0
▲2.0
7.6 Jun.
▲0.7
▲0.6
1.8
1.5
2.4
4.6
1.1
0.5
▲2.3
▲5.5
7.9
8.5
9.1
▲2.2
3.9
5.2
7.6
5.5
4.1
10.1
7.8
▲0.1
▲6.3
▲6.3
10.8
13.1
11.8
4.3
12.4 Aug.
▲2.6
2.1
4.3
2.7
4.8
8.8
▲2.3
▲0.1
10.2
3.0
7.5
12.4
8.4
0.3
10.2 Sep.
6.2
▲1.7
2.9
4.1
4.4
6.6
4.6
1.4
12.2
▲1.0
1.6
10.6
8.8
▲2.7
9.6 Oct.
2.0
▲3.8
5.7
1.7
2.5
2.9
▲8.8
1.6
6.1
▲2.9
▲2.6
12.1
9.4
▲1.8
10.6 Nov.
4.5
▲6.7
6.9
3.3
3.8
3.9
0.8
3.2
0.4
▲3.7
3.0
15.9
9.4
▲3.1
12.2 Dec.
3.2
1.7
7.5
2.7
5.0
8.4
4.1
5.0
10.7
▲3.3
0.0
7.8
9.0
▲1.2
5.6
5.0
4.8
2.6
6.6
10.3
9.9
5.1
15.3
1.0
▲0.2
9.2
8.9
1.3
Note1 "Others" of wholesale trade refers to the items classified as 536,553,559(excluding 5598) under the Japan Standard Industrial Classification.
Note2 "Others" of retail trade refers to the items classified as 5914,592,60(excludeing 603 and 605) under the Japan Standard Industrial Classification.
Note3 "Reference(*3)" is total of "Medicine & Toiletry Stores" and "Others(*2)".
Note4 The percentage change from the same month/term of the previous year is calculated using the linked coefficient to adjust for discrepancies.Refer to the Appendix table.
15
Sales value ( billion yen )
Furniture
&
House
Furnishings
10.8 Q4
8.8 Jul.
8.5 Jan. 2023
9.0 Feb.
(%)
Retail
Others
医 薬 品
・
化 粧 品
小 売 業
Percentage change from the same month/term of the previous year
その他の
機械器具
卸 売 業
家 具・
建 具・
じゅう器
卸 売 業
小 売 業
医 薬 品
・
化 粧 品
卸 売 業
その他の
卸 売 業
各種商品
(注1)
小 売 業
織物・衣
服・身の
回 り 品
小 売 業
飲食料品
自 動 車
機械器具
燃
料
小 売 業
小 売 業
小 売 業
小 売 業
そ の 他
小 売 業
無 店 舗
(注2)
小 売 業
考
(注3)
Year
and
Month
Medicines
&
Toiletries
General
Others
(*1)
Merchandise
Fabrics Apparel
& Accessories
Food
&
Beverages
Motor
Vehicles
Machinery
&
Equipment
Fuel
Medicine
&
Toiletry
Stores
Others
(*2)
Nonstore
retailers
Reference
(*3)
7,966
4,122
28,193
31,384
146,457
10,207
8,638
45,145
16,592
9,429
11,893
14,259
19,503
10,791
33,762 C.Y. 2020
9,131
4,460
30,698
35,658
150,462
10,346
8,610
45,328
17,001
10,035
13,839
15,026
18,862
11,416
33,888
2021
9,248
4,329
31,850
37,749
154,402
10,968
8,707
45,521
16,285
9,745
15,248
16,256
20,304
11,369
36,561
2022
5,577
2,430
25,903
28,905
145,208
11,530
10,686
45,401
18,135
6,513
12,889
11,025
21,068
7,963
8,628
4,446
29,005
32,387
147,858
10,063
8,353
44,900
16,959
10,276
11,782
14,901
19,242
11,381
34,143
2020
9,113
4,383
30,940
36,555
150,582
10,396
8,562
45,282
16,383
9,898
14,490
15,170
18,950
11,451
34,120
2021
2,279
1,191
8,180
9,683
39,978
3,034
2,652
11,925
3,871
2,570
3,940
3,882
5,032
3,073
8,914 Q4
2021
2,432
1,054
7,328
9,328
37,349
2,547
1,983
10,669
4,448
2,545
3,972
3,796
4,662
2,728
8,458 Q1
2022
2,157
1,049
7,861
9,355
37,463
2,622
2,220
11,132
3,679
2,356
3,650
3,866
5,134
2,804
9,000 Q2
2,284
1,084
8,054
9,091
38,180
2,632
1,886
11,542
4,058
2,340
3,656
4,210
5,014
2,843
9,224 Q3
2,376
1,141
8,608
9,974
41,410
3,167
2,618
12,177
4,100
2,504
3,970
4,384
5,495
2,994
9,879 Q4
820
427
2,939
3,308
14,631
1,209
960
4,398
1,368
972
1,447
1,368
1,792
1,118
3,160 Dec. 2021
711
304
2,350
2,814
12,238
876
736
3,546
1,234
860
1,318
1,250
1,542
876
2,793 Jan. 2022
731
337
2,342
2,934
11,523
754
520
3,383
1,357
731
1,292
1,196
1,423
865
2,620 Feb.
989
414
2,635
3,580
13,588
917
727
3,740
1,856
954
1,361
1,349
1,697
988
3,046 Mar.
722
368
2,845
3,290
12,572
847
743
3,672
1,276
801
1,254
1,295
1,751
935
3,045 Apr.
660
317
2,397
2,942
12,401
877
770
3,790
1,118
770
1,185
1,266
1,718
907
2,984 May
774
365
2,619
3,123
12,489
898
708
3,670
1,285
785
1,211
1,305
1,665
962
2,970 Jun.
724
366
2,629
2,991
13,036
950
701
3,868
1,368
837
1,256
1,390
1,701
965
3,091 Jul.
739
347
2,703
2,930
12,514
838
588
3,924
1,176
727
1,223
1,434
1,668
936
3,101 Aug.
821
370
2,722
3,170
12,630
844
596
3,750
1,514
776
1,178
1,386
1,646
942
3,032 Sep.
759
361
2,697
3,267
13,096
929
834
3,866
1,320
798
1,239
1,403
1,774
932
3,177 Oct.
760
382
2,770
3,291
13,123
983
816
3,774
1,407
770
1,240
1,396
1,760
979
3,155 Nov.
857
398
3,141
3,416
15,191
1,256
967
4,538
1,373
936
1,491
1,585
1,961
1,083
3,546 Dec.
734
309
2,526
2,889
12,851
949
766
3,725
1,366
831
1,318
1,348
1,681
865
3,030 Jan. 2023
772
354
2,454
3,009
12,282
832
571
3,554
1,565
738
1,289
1,306
1,550
876
2,856 Feb.
▲24.0
▲9.0
▲6.0
▲6.0
▲3.2
▲15.5
▲16.8
1.3
▲8.8
2.6
▲9.5
1.3
0.5
3.5
3.4
▲2.3
6.0
10.5
1.9
0.8
0.9
0.7
2.5
0.7
15.8
0.5
▲1.6
1.2
▲0.6
2021
1.3
▲2.9
3.8
5.9
2.6
6.0
1.1
0.4
▲4.2
▲2.9
10.2
8.2
7.6
▲0.4
7.9
2022
32,093 F.Y. 2019
0.4 C.Y. 2020
▲4.9
▲3.9
2.0
▲4.3
▲0.4
▲4.5
▲2.8
0.6
▲0.8
0.4
▲3.1
5.0
▲1.0
1.8
▲22.6
▲11.0
▲5.3
▲5.1
▲2.8
▲15.1
▲16.6
0.8
▲6.4
6.6
▲10.5
▲0.2
1.1
4.6
0.3
2020
5.6
▲1.4
6.7
12.9
1.8
3.3
2.5
0.9
▲3.4
▲3.7
23.0
1.8
▲1.5
0.6
▲0.1
2021
0.9 F.Y. 2019
2.0
▲0.3
3.1
11.5
1.3
2.3
1.4
2.4
▲13.5
▲6.3
25.9
2.2
▲0.8
2.0
0.5 Q4
2021
▲0.7
▲6.8
3.4
10.6
0.3
2.0
▲2.4
▲0.4
▲12.2
▲5.1
19.6
3.9
1.9
1.3
2.8 Q1
2022
1.8
▲2.5
1.7
7.1
2.8
10.6
6.9
▲0.2
▲8.8
▲0.5
13.5
4.2
9.5
▲0.8
7.2 Q2
0.0
2.1
4.6
3.2
3.7
7.6
2.0
0.1
0.7
▲3.1
8.7
11.3
9.8
0.7
10.5 Q3
4.3
▲4.2
5.2
3.0
3.6
4.4
▲1.3
2.1
5.9
▲2.6
0.8
12.9
9.2
▲2.6
1.0
0.7
2.3
7.9
1.2
3.0
2.2
0.4
▲8.4
▲8.8
23.5
1.2
▲1.8
6.3
▲0.5 Dec. 2021
7.0
▲3.9
6.6
9.1
1.1
5.6
3.8
▲0.7
▲16.9
▲4.4
22.8
4.6
4.3
1.8
4.4 Jan. 2022
3.6
▲7.4
4.8
10.9
▲0.9
▲1.7
▲3.5
▲0.7
▲15.1
▲8.1
21.0
3.3
▲0.7
0.1
1.1 Feb.
▲8.3
▲8.4
▲0.5
11.7
0.7
1.9
▲7.2
0.0
▲6.3
▲3.3
15.5
3.9
2.0
1.9
2.9 Mar.
▲2.8
▲7.0
▲0.6
7.8
3.1
8.0
9.7
0.5
▲7.5
0.8
13.8
3.0
9.7
▲1.6
6.8 Apr.
1.7
▲0.6
4.5
7.6
3.7
20.7
12.9
▲0.1
▲11.1
▲2.7
15.2
5.1
8.7
1.3
7.2 May
6.6
0.8
1.8
6.0
1.5
4.5
▲1.5
▲1.2
▲8.1
0.4
11.8
4.6
10.0
▲2.0
7.6 Jun.
▲0.7
▲0.6
1.8
1.5
2.4
4.6
1.1
0.5
▲2.3
▲5.5
7.9
8.5
9.1
▲2.2
3.9
5.2
7.6
5.5
4.1
10.1
7.8
▲0.1
▲6.3
▲6.3
10.8
13.1
11.8
4.3
12.4 Aug.
▲2.6
2.1
4.3
2.7
4.8
8.8
▲2.3
▲0.1
10.2
3.0
7.5
12.4
8.4
0.3
10.2 Sep.
6.2
▲1.7
2.9
4.1
4.4
6.6
4.6
1.4
12.2
▲1.0
1.6
10.6
8.8
▲2.7
9.6 Oct.
2.0
▲3.8
5.7
1.7
2.5
2.9
▲8.8
1.6
6.1
▲2.9
▲2.6
12.1
9.4
▲1.8
10.6 Nov.
4.5
▲6.7
6.9
3.3
3.8
3.9
0.8
3.2
0.4
▲3.7
3.0
15.9
9.4
▲3.1
12.2 Dec.
3.2
1.7
7.5
2.7
5.0
8.4
4.1
5.0
10.7
▲3.3
0.0
7.8
9.0
▲1.2
5.6
5.0
4.8
2.6
6.6
10.3
9.9
5.1
15.3
1.0
▲0.2
9.2
8.9
1.3
Note1 "Others" of wholesale trade refers to the items classified as 536,553,559(excluding 5598) under the Japan Standard Industrial Classification.
Note2 "Others" of retail trade refers to the items classified as 5914,592,60(excludeing 603 and 605) under the Japan Standard Industrial Classification.
Note3 "Reference(*3)" is total of "Medicine & Toiletry Stores" and "Others(*2)".
Note4 The percentage change from the same month/term of the previous year is calculated using the linked coefficient to adjust for discrepancies.Refer to the Appendix table.
15
Sales value ( billion yen )
Furniture
&
House
Furnishings
10.8 Q4
8.8 Jul.
8.5 Jan. 2023
9.0 Feb.
(%)
Retail
Others
医 薬 品
・
化 粧 品
小 売 業
Percentage change from the same month/term of the previous year
その他の
機械器具
卸 売 業
家 具・
建 具・
じゅう器
卸 売 業


