よむ、つかう、まなぶ。
商業動態統計速報 2023年2月分 (20 ページ)
出典
| 公開元URL | https://www.meti.go.jp/statistics/tyo/syoudou/result/sokuho_2.html |
| 出典情報 | 商業動態統計速報 2023年2月分(3/31)《経済産業省》 |
ページ画像
ダウンロードした画像を利用する際は「出典情報」を明記してください。
低解像度画像をダウンロード
プレーンテキスト
資料テキストはコンピュータによる自動処理で生成されており、完全に資料と一致しない場合があります。
テキストをコピーしてご利用いただく際は資料と付け合わせてご確認ください。
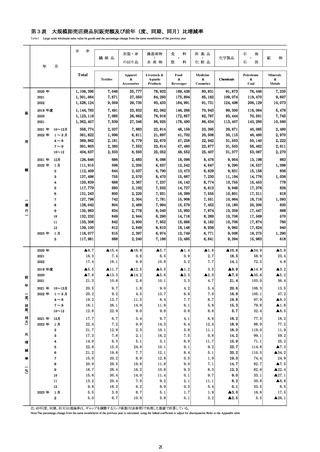
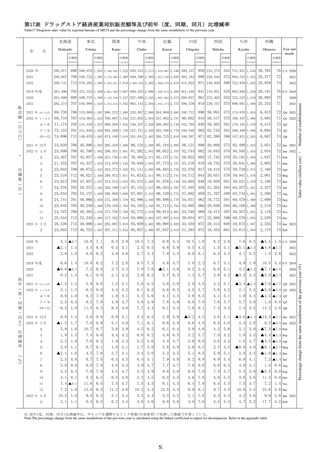
第3表
Table3
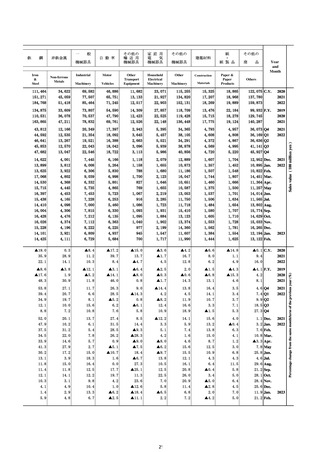
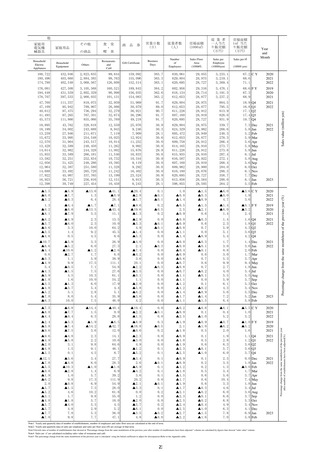
大規模卸売店商品別販売額及び前年(度、同期、同月)比増減率
Large-scale wholesale sales value by goods and the percentage change from the same month/term of the previous year
合
計
衣服・身
の回り品
農畜産物
・
水 産 物
Apparel
&
Accessories
Livestock &
Aquatic
Products
繊 維 品
年
Textiles
2020 年
2021
2022
2019 年度
2020
2021
2021 年
10~12月
2022 年
1~3月
4~6
売
7~9
10~12
2021 年
12月
2022 年
1月
額
2
3
4
5
6
(
7
億
8
円
9
)
10
11
12
2023 年
1月
2
2020 年
2021
2022
2019 年度
前
年
(
度
、
同
期
、
同
月
)
2020
2021
2021 年
10~12月
2022 年
1~3月
4~6
7~9
10~12
2021 年
12月
2022 年
1月
2
比
3
増
4
5
減
6
7
率
8
(
%
)
9
10
11
12
2023 年
料
化学製品
料
医 薬 品
・
化 粧 品
Food
&
Beverages
Medicine
&
Cosmetics
Chemicals
・
飲
石
油
鉱
・
石
物
炭
月
Total
販
食
1月
2
Petroleum
&
Coal
Minerals
&
Metals
1,106,395
1,301,664
1,528,124
7,046
7,671
9,059
25,777
27,050
29,735
78,922
84,293
93,433
169,438
175,894
184,991
80,831
85,182
91,731
91,873
109,074
124,498
76,446
119,470
206,129
7,235
9,607
10,073
1,144,783
1,123,116
1,362,457
7,491
7,085
7,839
23,832
26,662
27,346
82,062
78,916
86,925
146,266
172,857
178,490
70,943
82,767
86,634
99,300
93,444
113,407
116,064
70,591
143,280
5,476
7,745
10,560
358,774
361,822
369,862
391,803
404,637
2,037
1,996
2,181
2,380
2,503
7,883
6,811
6,779
7,552
8,593
22,814
21,897
22,670
23,814
25,052
48,159
41,702
47,258
47,480
48,552
23,395
20,506
22,942
22,877
25,407
29,671
30,115
31,503
31,503
31,377
40,085
46,460
50,140
56,462
53,067
2,480
2,970
2,222
2,611
2,270
126,646
111,915
112,409
137,498
120,839
117,779
131,243
127,798
128,042
135,963
132,232
133,306
139,100
118,077
117,981
686
596
644
755
688
693
800
742
804
834
849
842
812
615
688
2,683
2,205
2,037
2,570
2,367
2,192
2,220
2,304
2,469
2,778
2,944
2,800
2,849
2,397
2,240
8,088
6,637
6,790
8,470
7,237
7,502
7,931
7,781
7,994
8,040
8,290
7,952
8,810
6,974
7,186
18,096
12,542
13,473
15,687
16,142
14,727
16,389
15,908
15,579
15,993
14,718
15,686
18,148
12,749
13,485
8,476
6,647
6,629
7,230
8,774
6,613
7,555
7,551
7,452
7,874
8,289
8,182
8,936
6,771
6,841
9,954
9,290
9,631
11,194
10,755
9,948
10,801
10,964
10,180
10,359
10,706
10,706
9,965
9,008
9,394
13,198
16,527
15,156
14,776
15,453
17,376
17,311
18,716
20,300
17,447
17,569
17,874
17,624
19,275
15,983
883
1,098
836
1,036
778
826
618
1,093
830
688
570
760
940
1,290
618
▲9.7
16.3
17.4
▲15.4
7.4
18.1
▲16.9
0.6
9.9
▲5.7
6.5
10.8
▲1.4
0.9
5.2
▲1.6
2.7
7.7
▲10.6
18.5
14.1
▲34.9
58.9
72.5
▲3.8
23.4
4.8
▲5.5
▲7.8
21.3
▲11.7
▲13.3
10.6
▲12.5
▲14.2
2.6
▲0.5
▲5.6
10.1
▲1.2
▲2.3
3.3
3.5
▲2.0
4.7
▲9.9
▲7.0
21.4
▲14.9
▲35.6
103.0
▲3.2
▲5.2
36.4
20.5
20.2
19.2
18.1
12.8
9.7
9.2
13.7
26.1
22.9
1.8
4.5
11.5
14.9
9.0
9.0
13.7
8.4
11.8
9.8
4.2
6.6
7.7
6.1
0.8
5.4
7.6
8.7
5.8
8.6
20.6
16.8
19.8
15.3
5.7
106.3
105.1
97.9
79.8
32.4
13.5
47.2
▲9.3
▲1.8
▲8.5
17.7
22.4
21.7
17.3
14.0
22.8
21.2
15.0
20.9
18.7
15.6
13.2
9.8
5.5
5.0
6.7
7.2
12.9
7.8
6.3
15.0
19.6
20.2
29.5
28.4
30.4
20.4
18.3
3.0
6.7
3.4
9.9
2.3
2.1
5.1
24.0
7.7
8.9
19.6
16.2
14.0
7.0
6.2
8.7
10.0
9.7
14.3
10.1
16.2
3.1
10.1
12.1
12.8
11.8
10.8
11.4
9.2
8.9
5.1
5.8
4.1
6.4
5.8
7.5
6.0
9.1
8.4
0.5
9.0
9.3
0.1
2.1
0.3
1.7
0.1
6.6
12.4
11.1
0.8
11.7
9.2
5.1
1.9
7.1
8.3
9.7
11.1
5.4
1.9
3.2
16.2
18.9
18.0
14.2
15.9
23.7
20.2
19.0
14.7
12.3
9.0
8.2
0.1
▲3.0
▲2.5
77.3
98.9
119.0
99.1
71.1
114.8
110.5
74.4
82.7
82.6
33.1
30.6
33.5
16.6
5.5
18.2
77.2
11.9
59.2
25.2
▲7.3
▲34.2
24.9
▲7.5
▲22.4
▲27.1
▲6.8
6.5
17.5
▲26.1
注:前年(度、同期、同月)比増減率は、ギャップを調整するリンク係数(付表参照)で処理した数値で計算している。
Note:The percentage change from the same month/term of the previous year is calculated using the linked coefficient to adjust for discrepancies Refer to the Appendix table
20


