よむ、つかう、まなぶ。
商業動態統計速報 2023年2月分 (50 ページ)
出典
| 公開元URL | https://www.meti.go.jp/statistics/tyo/syoudou/result/sokuho_2.html |
| 出典情報 | 商業動態統計速報 2023年2月分(3/31)《経済産業省》 |
ページ画像
ダウンロードした画像を利用する際は「出典情報」を明記してください。
低解像度画像をダウンロード
プレーンテキスト
資料テキストはコンピュータによる自動処理で生成されており、完全に資料と一致しない場合があります。
テキストをコピーしてご利用いただく際は資料と付け合わせてご確認ください。
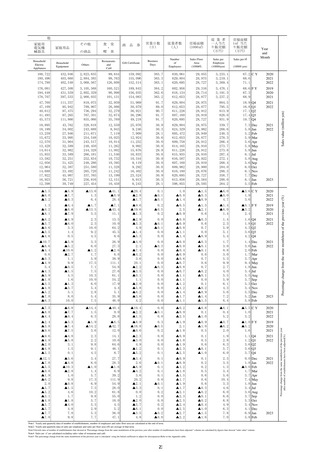
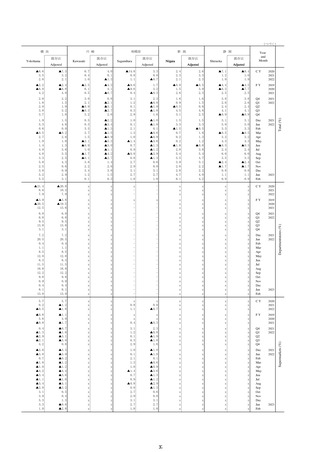
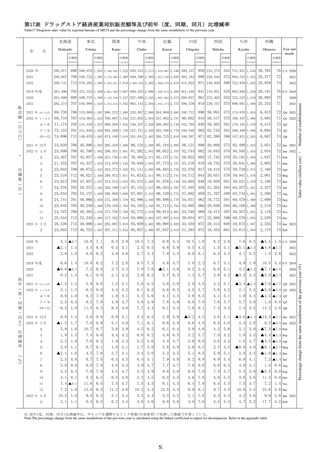
第14表 家電大型専門店経済産業局別販売額等及び前年(度、同期、同月)比増減率
Table14 Large-scale speciality retailers for home electric appliances sales value by regional bureaus of METI and the percentage change from the same month/term of the previous year
中国
四国
九州
沖縄
Hokkaido
Tohoku
Kanto
Chubu
Kansai
Chugoku
Shikoku
Kyushu
Okinawa
店舗数
店舗数
店舗数
店舗数
店舗数
店舗数
店舗数
店舗数
店舗数
Es abl shmen s
Establishments
Establ shmen s
Establishments
Establishments
Es ablishments
Establishments
Es abl shmen s
2,275,248
92 223,621 174
92 242,028 173
92 230,208 175
2,108,797
38,374
38,879
4~6 36,534
7~9 35,893
10~12 37,469
92
92
92
92
94
56,493
61,079
53,375
55,747
56,466
174
175
175
175
175
566,142
964
964
535,746 975
553,983 977
573,035 978
110,401
317
319
102,588 320
110,094 320
110,563 322
226,616
574,065
114,100
226,549
471
473
209,164 477
222,986 476
232,641 476
62,391
65,701
56,183
62,610
62,865
177
178
180
180
181
14,720
12,760
10,234
15,885
12,562
12,313
11,659
12,904
10,948
12,041
11,668
11,376
14,425
13,424
10,691
92
92
92
92
92
92
92
92
92
92
93
94
94
94
94
21,813
23,211
16,016
21,852
16,963
17,906
18,506
20,860
17,426
17,461
17,166
17,542
21,758
23,794
16,204
174
174
174
175
174
175
175
175
175
175
175
175
175
175
175
224,308
964
964
965
964
971
974
975
977
978
977
977
979
978
976
977
44,596
39,625
31,742
42,733
31,386
33,690
37,512
40,183
33,783
36,128
32,238
32,623
45,702
38,818
31,873
93,576
76,946
63,726
85,877
65,163
68,972
75,029
81,087
68,408
73,491
64,937
69,766
97,938
77,894
67,526
25,329
21,599
18,460
25,642
17,183
18,208
20,792
23,203
19,270
20,137
18,031
18,772
26,062
21,055
18,592
152,312
2022
148,775
2019 年度
149,070
2020
155,961
2021
151,468
2021 年
10~12月
2022 年
1~3月
2022 年 1月
2
4
5
(
6
店
7
)
8
9
10
11
12
2023 年 1月
2
2020 年
2021
2022
2019 年度
2020
2021
2021 年
10~12月
2022 年
1~3月
4~6
7~9
10~12
2021 年 12月
2022 年 1月
2
3
4
5
6
7
8
9
10
11
12
2023 年 1月
2
Year and
month
Establishments
92 237,092 175
92 232,866 174
94 226,667 175
152,909
店
舗
数
(
%
)
近畿
2021
3
前
年
(
度
・
同
期
・
同
月
)
比
増
減
率
中部
2020 年
2021 年 12月
・
関東
2,227,769
2,236,829
2,339,220
2,223,049
200,740
164,827
208,498
173,906
177,836
184,004
200,776
172,509
180,698
171,541
173,121
228,373
199,098
165,471
938 458,986 313 898,291 455 260,276 177 106,955
964 440,331 317 877,081 471 250,866 177 105,427
978 437,345 322 891,340 476 247,359 181 103,377
87 366,114 304 36,888
87 355,301 319 44,719
88 347,377 323 45,292
25
32
33
C.Y. 2020
924 440,957 310 871,726 460 247,938 174 100,298
940 467,925 310 917,381 455 267,152 175 110,666
964 440,257 319 877,931 473 249,625 178 104,455
87 344,170 302 34,553
88 377,710 306 39,168
88 352,882 321 45,837
23
32
32
F Y 2019
25,827
27,079
24,698
26,017
25,583
87
88
88
88
88
85,259
92,602
83,171
85,555
86,049
319
321
323
323
323
10,318
11,476
12,320
11,196
10,300
32
32
33
33
33
Q4 2021
177 10,643
178 9,292
178 7,763
178 10,024
180 7,519
180 7,995
180 9,184
180 9,627
180 8,248
180 8,142
181 7,259
182 7,420
181 10,904
181 8,884
181 7,504
87
88
88
88
88
88
88
88
88
88
88
88
88
88
88
33,889
31,886
26,329
34,387
26,784
27,329
29,058
32,023
27,298
26,234
25,506
25,172
35,371
31,780
25,760
319
319
320
321
322
323
323
323
323
323
323
323
323
322
323
3,961
3,841
3,243
4,392
4,000
3,825
4,495
4,292
3,521
3,383
3,214
3,085
4,001
3,701
3,080
32
32
32
32
32
32
33
33
33
33
33
33
33
33
33
Dec 2021
317
317
318
319
320
320
320
320
320
320
322
322
322
321
321
471
472
472
473
474
475
477
477
475
476
475
476
476
477
478
2021
2022
2020
2021
Q1 2022
Q2
Q3
Q4
Jan 2022
Feb
Mar.
Apr
May
Jun
Jul
Aug.
Sep
Oct
Nov.
Dec
Jan 2023
Feb
1.6 0.0
▲0.4 0.0
▲2.3 2.2
6.5 ▲0.6
▲1.8 ▲0.6
▲2.7 0.6
6.7 1.5
▲2.2 2.8
0.4 1.5
2.9 0.0
▲4.1 1.3
▲0.7 1.6
2.1 ▲1.9
▲2.4 3.5
1.6 1.1
4.2 1.7
▲3.6 0.0
▲1.4 2.3
6.1 0.0
▲1.4 0.0
▲1.9 1.1
7.0 1.3
▲2.8 4.9
▲2.2 1.3
5.6 8.7
21.2 28.0
1.3 3.1
C.Y. 2020
2.8 1.1
4.6 0.0
▲2.9 0.0
3.8 0.0
8.2 ▲0.6
▲4.9 1.2
1.9 2.1
9.9 1.7
▲5.0 2.6
0.8 1.0
6.1 0.0
▲5.9 2.9
3.7 1.1
5.2 ▲1.1
▲4.3 4.0
2.0 1.2
7.7 0.6
▲6.6 1.7
1.1 0.0
10.3 1.1
▲5.6 0.0
1.8 4.5
11.1 1.3
▲6.6 4.9
2.9 4.5
13.4 39.1
17.0 0.0
F Y 2019
▲7.6
▲2.1
5.2
▲9.1
▲2.4
▲7.4
▲4.2
▲2.9
▲3.4
▲0.0
▲7.1
▲0.8
▲0.9
2.2
1.2
2.8
2.6
2.5
2.5
1.5
▲6.7
▲0.1
▲0.3
▲2.5
0.1
1.3
2.9
2.9
2.6
1.6
▲3.2
0.4
3.5
0.2
2.7
3.5
4.0
4.1
1.9
1.1
▲7.7
▲1.9
▲2.1
▲2.4
0.8
0.0
1.7
2.3
2.3
2.3
▲5.0
▲3.5
0.6
▲3.6
▲0.9
0.0
0.0
0.0
1.1
1.1
▲8.4
▲2.5
▲3.0
▲4.2
0.9
28.0
0.0
3.1
3.1
3.1
Q4 2021
1.2
1.2
0.6
0.6
0.0 ▲9.2 ▲0.6
0.0 ▲2.1 ▲0.6
0.0 ▲10.7 ▲0.6
0.0 ▲1.1 1.2
0.0 ▲2.5 0.6
0.0 ▲5.4 1.2
1.1 ▲0.6 1.2
0.0 ▲5.8 0.6
0.0 ▲8.0 0.6
0.0
5.2 0.6
2.2 ▲2.7 0.6
2.2
3.0 1.2
2.2 ▲0.3 0.6
2.2
2.5 0.6
2.2
1.2 0.6
▲8.4
▲2.1
▲1.7
1.2
0.9
▲6.5
3.2
▲1.7
▲0.0
9.3
0.4
1.3
1.8
▲0.8
0.4
2.8
2.9
2.8
2.6
2.5
2.3
2.5
2.2
2.8
2.5
2.3
2.2
1.5
1.2
1.2
▲9.8
▲1.9
▲1.5
2.8
0.4
▲7.7
6.9
▲7.6
▲5.0
6.8
▲0.4
▲2.4
2.5
▲2.0
0.4
1.3
1.6
2.3
2.9
2.9
2.9
2.9
2.6
2.9
2.6
2.2
1.6
1.6
1.3
0.9
▲5.5
▲2.1
0.7
2.5
▲0.2
8.9
2.1
▲5.5
▲0.3
7.9
0.6
1.9
4.7
1.2
6.0
3.5 ▲11.4 0.0
3.7 ▲6.0 1.1
3.7 ▲2.3 1.7
4.0
2.2 1.7
3.7 ▲0.2 2.9
3.9 ▲6.3 2.3
4.1
0.4 2.3
2.4 ▲4.0 2.3
2.2 ▲3.3 2.3
1.9
0.2 2.3
1.7
0.8 2.8
1.1 ▲2.1 3.4
1.1
2.9 2.3
1.1 ▲2.5 1.7
1.3
0.7 1.7
▲8.8
▲6.3
▲3.3
▲0.8
3.0
▲8.7
8.1
▲6.2
▲5.9
2.2
▲2.1
▲4.5
2.5
▲4.4
▲3.3
0.0 ▲11.6 4.9
16.6 28.0
1.1 ▲4.6 4.9
16.6 28.0
0.0 ▲3.7 5.3
24.9 28.0
0.0
0.5 4.9 ▲1.7 0.0
0.0
0.2 4.5
5.4 0.0
0.0 ▲8.6 4.5 ▲14.5 0.0
0.0 ▲0.1 4.2
12.6 3.1
0.0 ▲2.6 1.6 ▲1.7 3.1
0.0 ▲5.8 1.6 ▲5.2 3.1
1.1 ▲4.4 1.6 ▲8.5 3.1
1.1
1.0 1.6 ▲1.8 3.1
1.1 ▲3.6 1.3
0.0 3.1
1.1
4.4 1.3
1.0 3.1
0.0 ▲0.3 0.9 ▲3.6 3.1
0.0 ▲2.2 0.9 ▲5.0 3.1
Dec 2021
▲7.9
▲5.8
▲9.5
6.8
8.8
6.9
▲0.2
▲12.3
▲13.6
▲0.4
▲1.2
▲3.9
▲2.0
5.2
4.5
0.0
0.0
1.1
0.0
2.2
▲0.6
注:前年(度、同期、同月)比増減率は、ギャップを調整するリンク係数(付表参照)で処理した数値で計算している。
Note:The percentage change from the same month/term of the previous year is calculated using the linked coefficient to adjust for discrepancies Refer to the appendix table
50
4.9
4.9
4.2
1.6
1.3
22.3
10.8
0.5
▲5.0
▲0.2
Sales value (million yen) ・ Number of establishments
販
売
額
(
百
万
円
)
月
東北
2021
2022
2020
2021
Q1 2022
Q2
Q3
Q4
Jan 2022
Feb
Mar.
Apr
May
Jun
Jul
Aug.
Sep
Oct
Nov.
Dec
Jan 2023
Feb
Percentage change from the same month/term of the previous year (%)
年
北海道


