


よむ、つかう、まなぶ。
商業動態統計速報 2023年2月分 (52 ページ)
出典
| 公開元URL | https://www.meti.go.jp/statistics/tyo/syoudou/result/sokuho_2.html |
| 出典情報 | 商業動態統計速報 2023年2月分(3/31)《経済産業省》 |
ページ画像
ダウンロードした画像を利用する際は「出典情報」を明記してください。
低解像度画像をダウンロード
プレーンテキスト
資料テキストはコンピュータによる自動処理で生成されており、完全に資料と一致しない場合があります。
テキストをコピーしてご利用いただく際は資料と付け合わせてご確認ください。
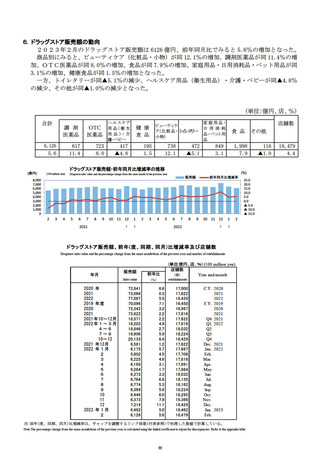
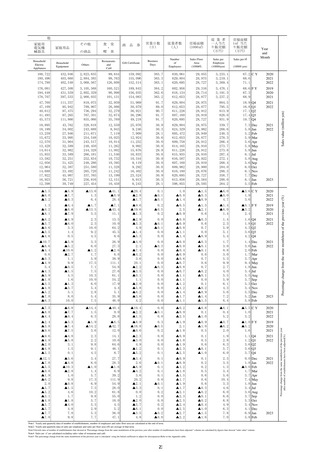
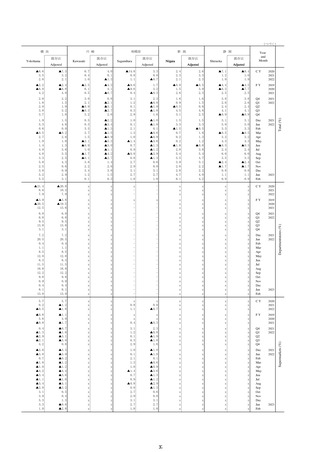
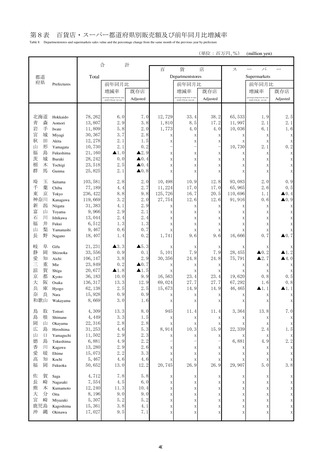
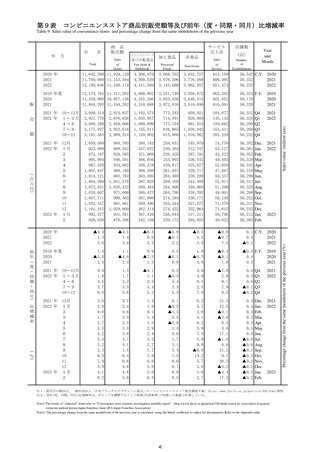
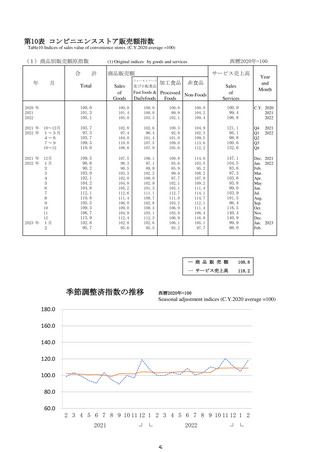
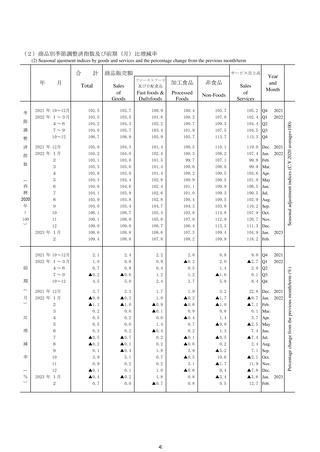
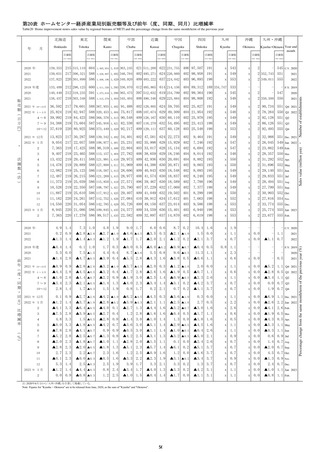
第16表
ドラッグストア商品別販売額等及び前年(度、同期、同月)比増減率
Table16 Drugstore sales value by goods and the percentage change from the same month/term of the previous year
月
Sales of goods
健康食品
ビューティ
ケア(化粧
品・小物)
トイレタ
リー
家庭用品・日
用消耗品・
ペット用品
食品
その他
Dispensing
pharmaceutical
products
Over the counter
medical products
Health care (sanitary
goods), nursing care,
and baby products
Health foods
Beauty care
(cosmetic products
and goods)
Toiletry goods
Household utensils,
daily necessities, pet
products
Food
Others
(店)
Number of
establishments
Year
and
Month
7,284,078
595,498
890,608
548,711
226,388
903,560
654,550
1,147,189
2,183,409
134,165
17,000 C Y 2020
2021
7,306,578
629,166
868,192
506,220
231,004
905,749
654,044
1,139,957
2,233,844
138,402
17,622
2021
2022
7,708,656
719,248
910,403
539,482
256,041
961,869
638,504
1,131,935
2,392,122
159,052
18,429
2022
2019 年度
7,009,551
569,237
908,890
463,886
224,578
1,003,216
639,068
1,068,933
2,008,449
123,294
16,450 F Y 2019
2020
7,234,182
599,159
872,678
530,124
225,105
887,914
653,447
1,136,842
2,193,027
135,886
16,967
2020
2021
7,392,230
652,635
868,606
514,772
236,294
911,373
656,580
1,140,298
2,267,880
143,792
17,816
2021
2021 年
10~12月
1,857,055
165,976
212,125
126,874
56,856
232,773
168,392
292,877
563,897
37,285
17,622 Q4 2021
2022 年
1~3月
1,820,175
175,452
215,294
133,625
59,504
218,463
157,160
262,375
561,485
36,817
17,816 Q1 2022
4~6
1,884,585
172,410
213,367
127,701
63,702
244,555
156,195
278,454
589,714
38,487
18,032 Q2
7~9
1,990,575
181,072
237,673
139,769
68,843
246,550
161,526
293,085
620,603
41,454
18,224 Q3
10~12
2,013,321
190,314
244,069
138,387
63,992
252,301
163,623
298,021
620,320
42,294
18,429 Q4
2021 年 12月
658,123
58,983
74,436
44,667
19,259
85,415
59,801
105,427
196,539
13,596
17,622 Dec 2021
2022 年 1月
617,500
55,433
72,066
46,917
20,036
76,152
56,246
93,114
184,181
13,355
17,667 Jan 2022
2
580,203
55,371
66,968
43,791
19,232
65,899
49,765
82,375
185,117
11,685
17,706 Feb
3
622,472
64,648
76,260
42,917
20,236
76,412
51,149
86,886
192,187
11,777
17,816 Mar
4
618,920
59,566
71,681
41,963
20,367
79,943
50,291
89,253
193,705
12,151
17,891 Apr
5
628,392
54,006
71,406
43,063
21,407
81,707
52,299
93,477
197,629
13,398
17,984 May
6
637,273
58,838
70,280
42,675
21,928
82,905
53,605
95,724
198,380
12,938
18,032 Jun
7
676,354
59,644
80,590
47,569
24,097
87,478
56,147
99,764
207,534
13,531
18,135 Jul
8
677,351
60,447
85,062
49,020
23,800
81,780
54,085
99,242
209,392
14,523
18,162 Aug
9
636,870
60,981
72,021
43,180
20,946
77,292
51,294
94,079
203,677
13,400
18,224 Sep
10
644,569
61,068
73,468
43,804
21,090
81,131
53,713
95,965
200,789
13,541
18,295 Oct
11
637,333
61,387
75,324
44,211
20,655
79,726
51,224
92,279
199,305
13,222
18,366 Nov
12
731,419
67,859
95,277
50,372
22,247
91,444
58,686
109,777
220,226
15,531
18,429 Dec
648,228
60,371
83,132
46,893
20,579
78,511
50,743
92,325
202,922
12,752
18,462 Jan 2023
612,559
61,703
72,328
41,671
19,517
73,848
47,243
84,893
199,784
11,572
18,479 Feb
2020 年
6.6
7.8
▲1.1
26.7
2.1
▲10.4
4.1
11.6
12.4
10.2
2021
0.3
5.7
▲2.5
▲7.7
2.0
0.2
▲0.1
▲0.6
2.3
3.2
3.7
2021
2022
5.5
14.3
4.9
6.6
10.8
6.2
▲2.4
▲0.7
7.1
14.9
4.6
2022
2019 年度
7.1
12.9
3.5
9.6
2.9
2.6
4.6
9.2
9.5
6.3
2020
3.2
5.3
▲4.0
14.3
0.2
▲11.5
2.2
6.4
9.2
10.2
3.1
2020
2021
2.2
8.9
▲0.5
▲2.9
5.0
2.6
0.5
0.3
3.4
5.8
5.0
2021
売
(
百
万
円
)
2023 年 1月
2
前
年
(
度
・
同
期
・
同
月
)
比
増
減
率
(
%
)
ヘルスケア用
品(衛生用
品)・介護・
ベビー
2020 年
販
額
OTC
医薬品
3.5 C Y 2020
3.7 F Y 2019
2021 年
10~12月
2.2
6.7
▲3.1
▲4.6
0.3
0.4
0.9
2.8
5.5
9.3
3.7 Q4 2021
2022 年
1~3月
4.9
15.4
0.2
6.8
9.8
2.6
1.6
0.1
6.5
17.2
5.0 Q1 2022
4~6
2.7
12.6
▲1.3
2.9
9.3
5.3
▲5.1
▲3.5
4.5
14.0
4.6 Q2
7~9
5.9
14.5
5.6
7.4
11.7
8.2
▲3.0
▲1.1
7.3
15.4
4.9 Q3
10~12
8.4
14.7
15.1
9.1
12.6
8.4
▲2.8
1.8
10.0
13.4
4.6 Q4
2021 年 12月
1.2
6.5
▲3.9
▲5.6
▲0.3
1.2
0.3
1.0
3.5
8.0
3.7 Dec 2021
2022 年 1月
5.7
16.2
3.4
3.9
10.2
5.9
6.4
2.1
4.4
22.4
4.8 Jan 2022
2
4.5
12.6
▲3.9
8.8
11.3
0.2
2.0
▲0.5
7.6
21.6
4.8 Feb
3
4.6
17.3
1.0
8.2
7.9
1.7
▲3.5
▲1.4
7.4
7.9
5.0 Mar
4
3.1
12.4
1.4
3.5
8.5
3.8
▲5.6
▲3.1
5.3
11.3
4.7 Apr
5
1.7
11.4
▲1.7
1.8
8.6
5.0
▲5.5
▲4.6
3.1
14.3
4.7 May
6
3.3
14.0
▲3.4
3.4
10.7
7.0
▲4.2
▲2.8
5.2
16.2
4.6 Jun
7
6.8
11.9
6.4
12.4
16.2
9.2
▲1.5
▲0.9
8.3
13.7
4.9 Jul
8
5.3
15.9
8.4
7.7
11.0
6.6
▲4.6
▲2.1
5.2
19.8
4.8 Aug
9
5.6
15.9
1.6
2.1
7.5
8.8
▲2.9
▲0.4
8.6
12.7
4.9 Sep
10
6.0
14.1
4.5
5.1
9.4
9.9
▲1.4
0.6
6.8
16.4
4.7 Oct
11
7.9
14.8
11.8
9.0
12.7
8.4
▲5.3
0.2
11.1
9.7
4.6 Nov
12
11.1
15.0
28.0
12.8
15.5
7.1
▲1.9
4.1
12.1
14.2
4.6 Dec
5.0
8.9
15.4
▲0.1
2.7
3.1
▲9.8
▲0.8
10.2
▲4.5
4.5 Jan 2023
5.6
11.4
8.0
▲4.8
1.5
12.1
▲5.1
3.1
7.9
▲1.0
4.4 Feb
2023 年 1月
2
注:前年(度、同期、同月)比増減率は、ギャップを調整するリンク係数(付表参照)で処理した数値で計算している。
Note:The percentage change from the same month/term of the previous year is calculated using the linked coefficient to adjust for discrepancies Refer to the appendix table
52
Sales value (million yen)
年
店舗数
調剤医薬
品
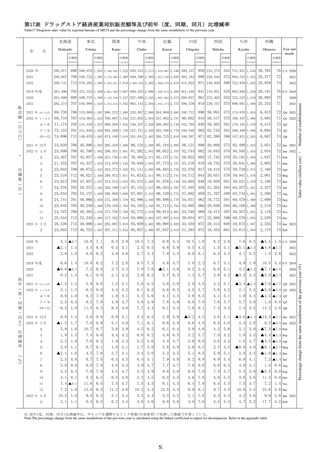
Percentage change from the same month/term of the previous year (%)
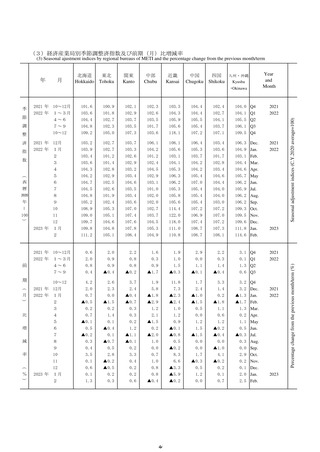
商品販売額
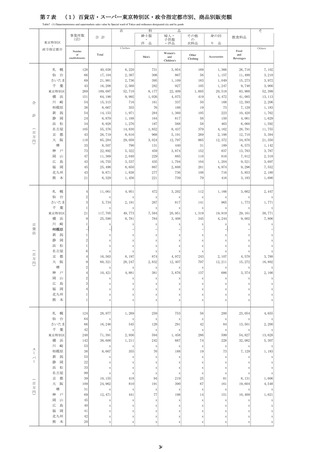
ドラッグストア商品別販売額等及び前年(度、同期、同月)比増減率
Table16 Drugstore sales value by goods and the percentage change from the same month/term of the previous year
月
Sales of goods
健康食品
ビューティ
ケア(化粧
品・小物)
トイレタ
リー
家庭用品・日
用消耗品・
ペット用品
食品
その他
Dispensing
pharmaceutical
products
Over the counter
medical products
Health care (sanitary
goods), nursing care,
and baby products
Health foods
Beauty care
(cosmetic products
and goods)
Toiletry goods
Household utensils,
daily necessities, pet
products
Food
Others
(店)
Number of
establishments
Year
and
Month
7,284,078
595,498
890,608
548,711
226,388
903,560
654,550
1,147,189
2,183,409
134,165
17,000 C Y 2020
2021
7,306,578
629,166
868,192
506,220
231,004
905,749
654,044
1,139,957
2,233,844
138,402
17,622
2021
2022
7,708,656
719,248
910,403
539,482
256,041
961,869
638,504
1,131,935
2,392,122
159,052
18,429
2022
2019 年度
7,009,551
569,237
908,890
463,886
224,578
1,003,216
639,068
1,068,933
2,008,449
123,294
16,450 F Y 2019
2020
7,234,182
599,159
872,678
530,124
225,105
887,914
653,447
1,136,842
2,193,027
135,886
16,967
2020
2021
7,392,230
652,635
868,606
514,772
236,294
911,373
656,580
1,140,298
2,267,880
143,792
17,816
2021
2021 年
10~12月
1,857,055
165,976
212,125
126,874
56,856
232,773
168,392
292,877
563,897
37,285
17,622 Q4 2021
2022 年
1~3月
1,820,175
175,452
215,294
133,625
59,504
218,463
157,160
262,375
561,485
36,817
17,816 Q1 2022
4~6
1,884,585
172,410
213,367
127,701
63,702
244,555
156,195
278,454
589,714
38,487
18,032 Q2
7~9
1,990,575
181,072
237,673
139,769
68,843
246,550
161,526
293,085
620,603
41,454
18,224 Q3
10~12
2,013,321
190,314
244,069
138,387
63,992
252,301
163,623
298,021
620,320
42,294
18,429 Q4
2021 年 12月
658,123
58,983
74,436
44,667
19,259
85,415
59,801
105,427
196,539
13,596
17,622 Dec 2021
2022 年 1月
617,500
55,433
72,066
46,917
20,036
76,152
56,246
93,114
184,181
13,355
17,667 Jan 2022
2
580,203
55,371
66,968
43,791
19,232
65,899
49,765
82,375
185,117
11,685
17,706 Feb
3
622,472
64,648
76,260
42,917
20,236
76,412
51,149
86,886
192,187
11,777
17,816 Mar
4
618,920
59,566
71,681
41,963
20,367
79,943
50,291
89,253
193,705
12,151
17,891 Apr
5
628,392
54,006
71,406
43,063
21,407
81,707
52,299
93,477
197,629
13,398
17,984 May
6
637,273
58,838
70,280
42,675
21,928
82,905
53,605
95,724
198,380
12,938
18,032 Jun
7
676,354
59,644
80,590
47,569
24,097
87,478
56,147
99,764
207,534
13,531
18,135 Jul
8
677,351
60,447
85,062
49,020
23,800
81,780
54,085
99,242
209,392
14,523
18,162 Aug
9
636,870
60,981
72,021
43,180
20,946
77,292
51,294
94,079
203,677
13,400
18,224 Sep
10
644,569
61,068
73,468
43,804
21,090
81,131
53,713
95,965
200,789
13,541
18,295 Oct
11
637,333
61,387
75,324
44,211
20,655
79,726
51,224
92,279
199,305
13,222
18,366 Nov
12
731,419
67,859
95,277
50,372
22,247
91,444
58,686
109,777
220,226
15,531
18,429 Dec
648,228
60,371
83,132
46,893
20,579
78,511
50,743
92,325
202,922
12,752
18,462 Jan 2023
612,559
61,703
72,328
41,671
19,517
73,848
47,243
84,893
199,784
11,572
18,479 Feb
2020 年
6.6
7.8
▲1.1
26.7
2.1
▲10.4
4.1
11.6
12.4
10.2
2021
0.3
5.7
▲2.5
▲7.7
2.0
0.2
▲0.1
▲0.6
2.3
3.2
3.7
2021
2022
5.5
14.3
4.9
6.6
10.8
6.2
▲2.4
▲0.7
7.1
14.9
4.6
2022
2019 年度
7.1
12.9
3.5
9.6
2.9
2.6
4.6
9.2
9.5
6.3
2020
3.2
5.3
▲4.0
14.3
0.2
▲11.5
2.2
6.4
9.2
10.2
3.1
2020
2021
2.2
8.9
▲0.5
▲2.9
5.0
2.6
0.5
0.3
3.4
5.8
5.0
2021
売
(
百
万
円
)
2023 年 1月
2
前
年
(
度
・
同
期
・
同
月
)
比
増
減
率
(
%
)
ヘルスケア用
品(衛生用
品)・介護・
ベビー
2020 年
販
額
OTC
医薬品
3.5 C Y 2020
3.7 F Y 2019
2021 年
10~12月
2.2
6.7
▲3.1
▲4.6
0.3
0.4
0.9
2.8
5.5
9.3
3.7 Q4 2021
2022 年
1~3月
4.9
15.4
0.2
6.8
9.8
2.6
1.6
0.1
6.5
17.2
5.0 Q1 2022
4~6
2.7
12.6
▲1.3
2.9
9.3
5.3
▲5.1
▲3.5
4.5
14.0
4.6 Q2
7~9
5.9
14.5
5.6
7.4
11.7
8.2
▲3.0
▲1.1
7.3
15.4
4.9 Q3
10~12
8.4
14.7
15.1
9.1
12.6
8.4
▲2.8
1.8
10.0
13.4
4.6 Q4
2021 年 12月
1.2
6.5
▲3.9
▲5.6
▲0.3
1.2
0.3
1.0
3.5
8.0
3.7 Dec 2021
2022 年 1月
5.7
16.2
3.4
3.9
10.2
5.9
6.4
2.1
4.4
22.4
4.8 Jan 2022
2
4.5
12.6
▲3.9
8.8
11.3
0.2
2.0
▲0.5
7.6
21.6
4.8 Feb
3
4.6
17.3
1.0
8.2
7.9
1.7
▲3.5
▲1.4
7.4
7.9
5.0 Mar
4
3.1
12.4
1.4
3.5
8.5
3.8
▲5.6
▲3.1
5.3
11.3
4.7 Apr
5
1.7
11.4
▲1.7
1.8
8.6
5.0
▲5.5
▲4.6
3.1
14.3
4.7 May
6
3.3
14.0
▲3.4
3.4
10.7
7.0
▲4.2
▲2.8
5.2
16.2
4.6 Jun
7
6.8
11.9
6.4
12.4
16.2
9.2
▲1.5
▲0.9
8.3
13.7
4.9 Jul
8
5.3
15.9
8.4
7.7
11.0
6.6
▲4.6
▲2.1
5.2
19.8
4.8 Aug
9
5.6
15.9
1.6
2.1
7.5
8.8
▲2.9
▲0.4
8.6
12.7
4.9 Sep
10
6.0
14.1
4.5
5.1
9.4
9.9
▲1.4
0.6
6.8
16.4
4.7 Oct
11
7.9
14.8
11.8
9.0
12.7
8.4
▲5.3
0.2
11.1
9.7
4.6 Nov
12
11.1
15.0
28.0
12.8
15.5
7.1
▲1.9
4.1
12.1
14.2
4.6 Dec
5.0
8.9
15.4
▲0.1
2.7
3.1
▲9.8
▲0.8
10.2
▲4.5
4.5 Jan 2023
5.6
11.4
8.0
▲4.8
1.5
12.1
▲5.1
3.1
7.9
▲1.0
4.4 Feb
2023 年 1月
2
注:前年(度、同期、同月)比増減率は、ギャップを調整するリンク係数(付表参照)で処理した数値で計算している。
Note:The percentage change from the same month/term of the previous year is calculated using the linked coefficient to adjust for discrepancies Refer to the appendix table
52
Sales value (million yen)
年
店舗数
調剤医薬
品
Percentage change from the same month/term of the previous year (%)
商品販売額