よむ、つかう、まなぶ。
商業動態統計速報 2023年2月分 (48 ページ)
出典
| 公開元URL | https://www.meti.go.jp/statistics/tyo/syoudou/result/sokuho_2.html |
| 出典情報 | 商業動態統計速報 2023年2月分(3/31)《経済産業省》 |
ページ画像
ダウンロードした画像を利用する際は「出典情報」を明記してください。
低解像度画像をダウンロード
プレーンテキスト
資料テキストはコンピュータによる自動処理で生成されており、完全に資料と一致しない場合があります。
テキストをコピーしてご利用いただく際は資料と付け合わせてご確認ください。
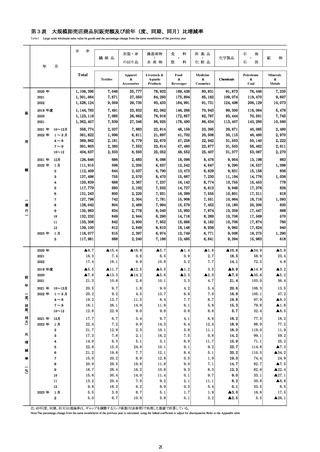
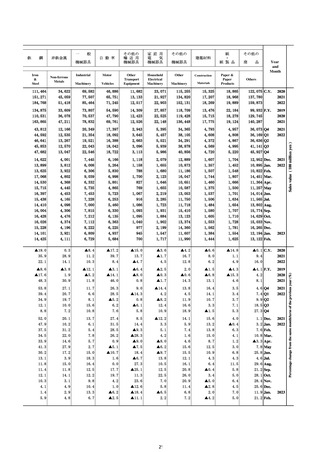
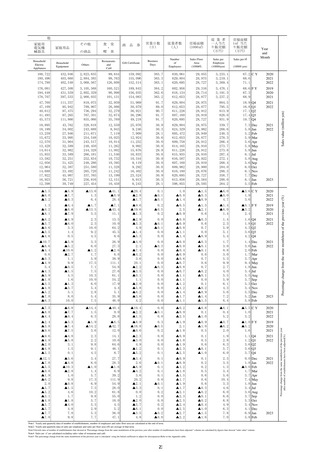
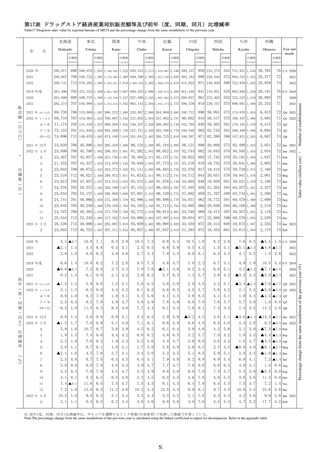
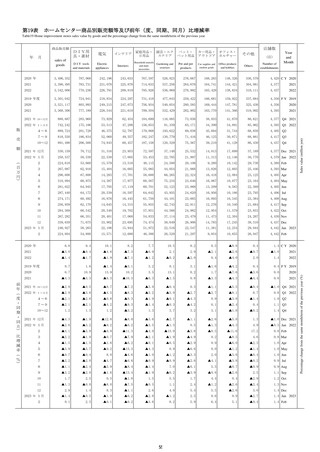
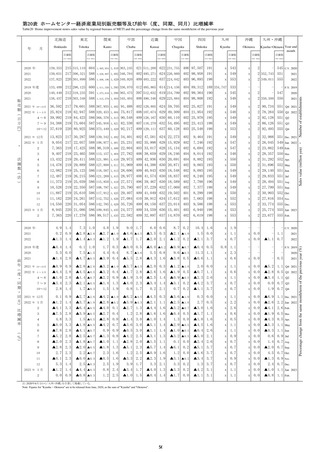
第13表
家電大型専門店商品別販売額等及び前年(度、同期、同月)比増減率
Table13 Large-scale speciality retailers for home electric appliances sales value by goods and the percentage change from the same month/term of the previous year
商品販売額
年
Audio visual home
electronics
ビジュアル家電 オーディオ家電
Visual home
electronics
情報家電
Information
appliances
Audio home
electronics
情報家電本体
情報家電周辺機器
Main unit
Peripherals
通信家電
カメラ類
Communication
appliances
Cameras
4,792,759
717,538
-
-
1,111,807
-
-
294,536
115,792
2021
4,686,672
668,014
511,392
156,622
1,052,817
542,032
510,785
328,306
110,646
2022
4,684,361
606,814
458,980
147,834
1,033,810
561,857
471,953
367,149
118,044
2019 年度
4,521,130
660,266
-
-
1,008,342
-
-
306,632
153,790
2020
4,917,211
724,322
-
-
1,143,258
-
-
305,215
113,072
2021
4,675,712
657,009
503,858
153,151
1,032,182
534,624
497,558
346,280
108,146
2021 年
10~12月
1,181,821
172,063
130,933
41,130
273,039
131,485
141,554
91,155
30,378
2022 年
1~3月
1,211,530
165,292
126,384
38,908
288,612
164,378
124,234
107,407
26,853
4~6
1,113,779
134,145
99,455
34,690
224,367
117,972
106,395
77,000
27,751
7~9
1,164,081
146,297
111,876
34,421
234,148
125,698
108,450
88,613
30,095
10~12
1,194,971
161,080
121,265
39,815
286,683
153,809
132,874
94,129
33,345
2021 年 12月
472,835
72,408
54,981
17,427
114,498
53,524
60,974
30,108
11,444
2022 年 1月
419,900
60,676
46,355
14,321
95,205
52,627
42,578
31,439
8,707
2
342,340
46,207
34,995
11,212
81,084
44,638
36,446
28,995
7,523
3
449,290
58,409
45,034
13,375
112,323
67,113
45,210
46,973
10,623
4
355,466
44,645
33,260
11,385
83,348
45,772
37,576
26,871
9,284
5
368,074
45,287
33,163
12,124
71,823
36,985
34,838
26,661
9,370
6
390,239
44,213
33,032
11,181
69,196
35,215
33,981
23,468
9,097
7
424,955
50,230
38,502
11,728
76,678
40,629
36,049
28,157
9,815
8
361,411
46,093
35,295
10,798
73,634
39,364
34,270
23,789
9,271
9
377,715
49,974
38,079
11,895
83,836
45,705
38,131
36,667
11,009
10
351,560
46,019
34,098
11,921
75,142
38,990
36,152
33,653
11,660
11
358,877
48,670
37,112
11,558
88,692
48,671
40,021
28,885
10,600
12
484,534
66,391
50,055
16,336
122,849
66,148
56,701
31,591
11,085
418,448
56,808
42,363
14,445
98,951
58,655
40,296
35,783
9,486
346,701
41,303
30,395
10,908
86,448
50,808
35,640
31,544
8,525
売
(
百
万
円
)
2023 年 1月
2
2020 年
5.1
9.3
-
-
12.6
-
-
▲11.8
▲29.3
2021
▲2.3
▲7.0
-
-
▲5.3
-
-
11.5
▲4.5
2022
▲0.0
▲9.2
▲10.2
▲5.6
▲1.8
3.7
▲7.6
11.8
6.7
2.2
7.6
-
-
6.0
-
-
▲14.9
▲13.5
2019 年度
前
年
(
度
・
同
期
・
同
月
)
比
増
減
率
(
%
)
AV家電
Sales of
goods
2020 年
販
額
月
2020
8.4
9.0
-
-
13.4
-
-
▲0.5
▲26.6
2021
▲4.9
▲9.3
-
-
▲9.7
-
-
13.5
▲4.4
2021 年
10~12月
▲6.2
▲12.2
-
-
▲9.2
-
-
▲1.3
▲8.5
2022 年
1~3月
▲0.9
▲6.2
▲5.6
▲8.2
▲6.7
▲4.3
▲9.6
20.1
▲8.5
4~6
▲0.1
▲10.3
▲12.5
▲3.4
▲8.4
▲7.9
▲8.9
7.4
9.4
7~9
▲0.3
▲14.0
▲15.8
▲7.4
3.8
13.6
▲5.7
16.6
17.8
10~12
1.1
▲6.4
▲7.4
▲3.2
5.0
17.0
▲6.1
3.3
9.8
2021 年 12月
▲8.3
▲16.4
-
-
▲12.1
-
-
▲2.7
▲1.5
2022 年 1月
▲2.5
▲5.8
▲4.4
▲10.2
▲8.2
▲7.4
▲9.1
4.2
0.0
2
▲2.0
▲9.4
▲9.4
▲9.7
▲4.9
▲2.2
▲8.1
19.0
▲12.7
3
1.6
▲4.0
▲3.9
▲4.7
▲6.6
▲3.2
▲11.3
34.7
▲11.7
4
0.7
▲7.1
▲6.9
▲7.4
▲8.6
▲6.5
▲11.1
1.1
2.2
5
▲3.9
▲9.1
▲12.6
2.2
▲10.8
▲12.4
▲9.0
7.8
13.4
6
2.8
▲14.6
▲17.4
▲5.0
▲5.5
▲4.7
▲6.3
15.0
13.5
7
▲3.9
▲21.5
▲25.0
▲7.7
▲0.1
8.7
▲8.5
20.8
5.7
8
▲2.3
▲10.4
▲10.4
▲10.4
0.1
9.1
▲8.6
1.0
27.2
9
6.4
▲8.4
▲9.7
▲4.2
11.4
22.8
0.1
25.8
22.6
10
0.1
▲6.1
▲8.1
0.4
▲3.0
▲1.2
▲4.9
▲0.5
17.4
11
0.3
▲3.9
▲4.4
▲2.3
9.4
26.4
▲6.0
6.1
17.8
12
2.5
▲8.3
▲9.0
▲6.3
7.3
23.6
▲7.0
4.9
▲3.1
2023 年 1月
2
▲0.3
▲6.4
▲8.6
0.9
3.9
11.5
▲5.4
13.8
8.9
1.3
▲10.6
▲13.1
▲2.7
6.6
13.8
▲2.2
8.8
13.3
注:前年(度、同期、同月)比増減率は、ギャップを調整するリンク係数(付表参照)で処理した数値で計算している。
Note:The percentage change from the same month/term of the previous year is calculated using the linked coefficient to adjust for discrepancies Refer to the appendix table
48


