【資料1】薬剤耐性ワンヘルス動向調査報告書年次報告書2021(たたき台) (79 ページ)
出典
| 公開元URL | https://www.mhlw.go.jp/stf/newpage_23261.html |
| 出典情報 | 国際的に脅威となる感染症対策関係閣僚会議 薬剤耐性ワンヘルス動向調査検討会(第9回 1/17)《厚生労働省》 |
ページ画像
プレーンテキスト
資料テキストはコンピュータによる自動処理で生成されており、完全に資料と一致しない場合があります。
テキストをコピーしてご利用いただく際は資料と付け合わせてご確認ください。
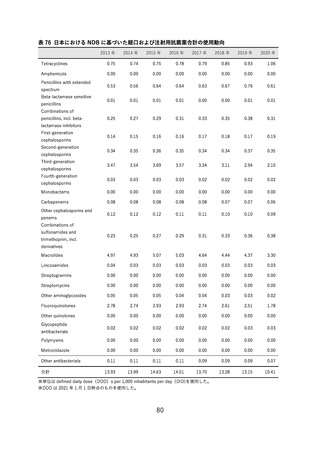
2013 年
2014 年
2015 年
2016 年
2017 年
2018 年
2019 年
2020 年
Tetracyclines
0.79
0.77
0.79
0.82
0.83
0.90
0.98
1.12
Amphenicols
<0.01
<0.01
<0.01
<0.01
<0.01
<0.01
<0.01
<0.01
0.63
0.64
0.70
0.68
0.67
0.71
0.79
0.63
0.01
0.01
0.01
0.01
0.01
0.01
0.01
0.01
0.29
0.31
0.34
0.36
0.38
0.41
0.45
0.36
First-generation cephalosporins
0.20
0.20
0.20
0.21
0.22
0.23
0.21
0.22
Second-generation cephalosporins
0.41
0.40
0.39
0.39
0.37
0.38
0.41
0.38
Third-generation cephalosporins
3.72
3.60
3.67
3.54
3.31
3.07
2.90
2.07
Penicillins with extended spectrum
Beta-lactamase sensitive
penicillins
Combinations of penicillins, incl.
beta-lactamase inhibitors
Fourth-generation cephalosporins
0.04
0.03
0.03
0.03
0.03
0.03
0.02
0.02
Monobactams
<0.01
<0.01
<0.01
<0.01
<0.01
<0.01
<0.01
<0.01
Carbapenems
0.10
0.10
0.10
0.10
0.09
0.09
0.09
0.07
Other cephalosporins and penems
0.14
0.14
0.13
0.12
0.12
0.11
0.10
0.09
0.25
0.27
0.29
0.32
0.34
0.36
0.39
0.41
Macrolides
4.84
4.51
4.59
4.56
4.18
3.96
3.84
2.93
Lincosamides
0.04
0.04
0.04
0.04
0.03
0.03
0.04
0.03
Streptogramins
<0.01
<0.01
<0.01
<0.01
<0.01
<0.01
<0.01
-
Streptomycins
<0.01
<0.01
<0.01
<0.01
<0.01
<0.01
<0.01
<0.01
Other aminoglycosides
0.05
0.05
0.05
0.04
0.04
0.03
0.03
0.03
Fluoroquinolones
2.86
2.86
2.74
2.78
2.60
2.45
2.35
1.68
Other quinolones
0.01
<0.01
<0.01
<0.01
<0.01
<0.01
<0.01
<0.01
Glycopeptide antibacterials
0.03
0.03
0.03
0.03
0.03
0.03
0.03
0.03
Combinations of sulfonamides and
trimethoprim, incl. derivatives
Polymyxins
-
-
<0.01
<0.01
<0.01
<0.01
<0.01
<0.01
Metronidazole
-
<0.01
<0.01
<0.01
<0.01
<0.01
<0.01
<0.01
0.12
0.12
0.12
0.12
0.10
0.10
0.10
0.08
14.52
14.08
14.23
14.15
13.36
12.91
12.75
10.18
Other antibacterials
合計
※単位は defined daily dose(DDD)s per 1,000 inhabitants per day(DID)を使用した。
※DDD は 2021 年 1 月 1 日時点のものを使用した。
表 74 AWaRe 分類により分類した日本における抗菌薬の使用動向
AWaRe 分類
Access (%)
Watch (%)
Reserve (%)
非推奨 (%)
未分類 (%)
Total
2013 年
2014 年
2015 年
2016 年
2017 年
2018 年
2019 年
1.60
1.64
1.76
1.81
1.87
2.03
2.22
2020 年
2.15
(10.99)
(11.66)
(12.34)
(12.78)
(14.03)
(15.76)
(17.42)
(21.09)
12.70
12.22
12.27
12.15
11.30
10.70
10.36
7.78
(87.50)
(86.84)
(86.20)
(85.82)
(84.59)
(82.89)
(81.24)
(76.42)
0.18
0.18
0.18
0.17
0.16
0.15
0.15
0.13
(1.27)
(1.28)
(1.24)
(1.20)
(1.18)
(1.16)
(1.15)
(1.26)
0.02
0.02
0.02
0.02
0.02
0.02
0.02
0.02
(0.16)
(0.16)
(0.16)
(0.15)
(0.16)
(0.16)
(0.16)
(0.17)
0.01
0.01
0.01
0.01
0.01
<0.01
<0.01
0.11
(0.08)
(0.07)
(0.06)
(0.05)
(0.01)
(0.04)
(0.03)
(1.06)
14.52
14.08
14.23
14.15
13.36
12.91
12.75
10.18
※単位は defined daily dose(DDD)s per 1,000 inhabitants per day(DID)を使用した。
※DDD は 2021 年 1 月 1 日時点のものを使用した。AWaRe 分類は 2021 年版を使用した。
78


